Graph sub-sampling for divide-and-conquer algorithms in large networks
Publication
Metrics
AI Quick Summary
This paper evaluates seven graph sub-sampling algorithms applied to divide-and-conquer methods for community structure and core-periphery structure detection in large networks. The study found that uniform random node sampling works best for community detection, while core node-focused sampling outperforms others for core-periphery structure identification, emphasizing the need for tailored sub-sampling strategies.
Paper Preview
Abstract
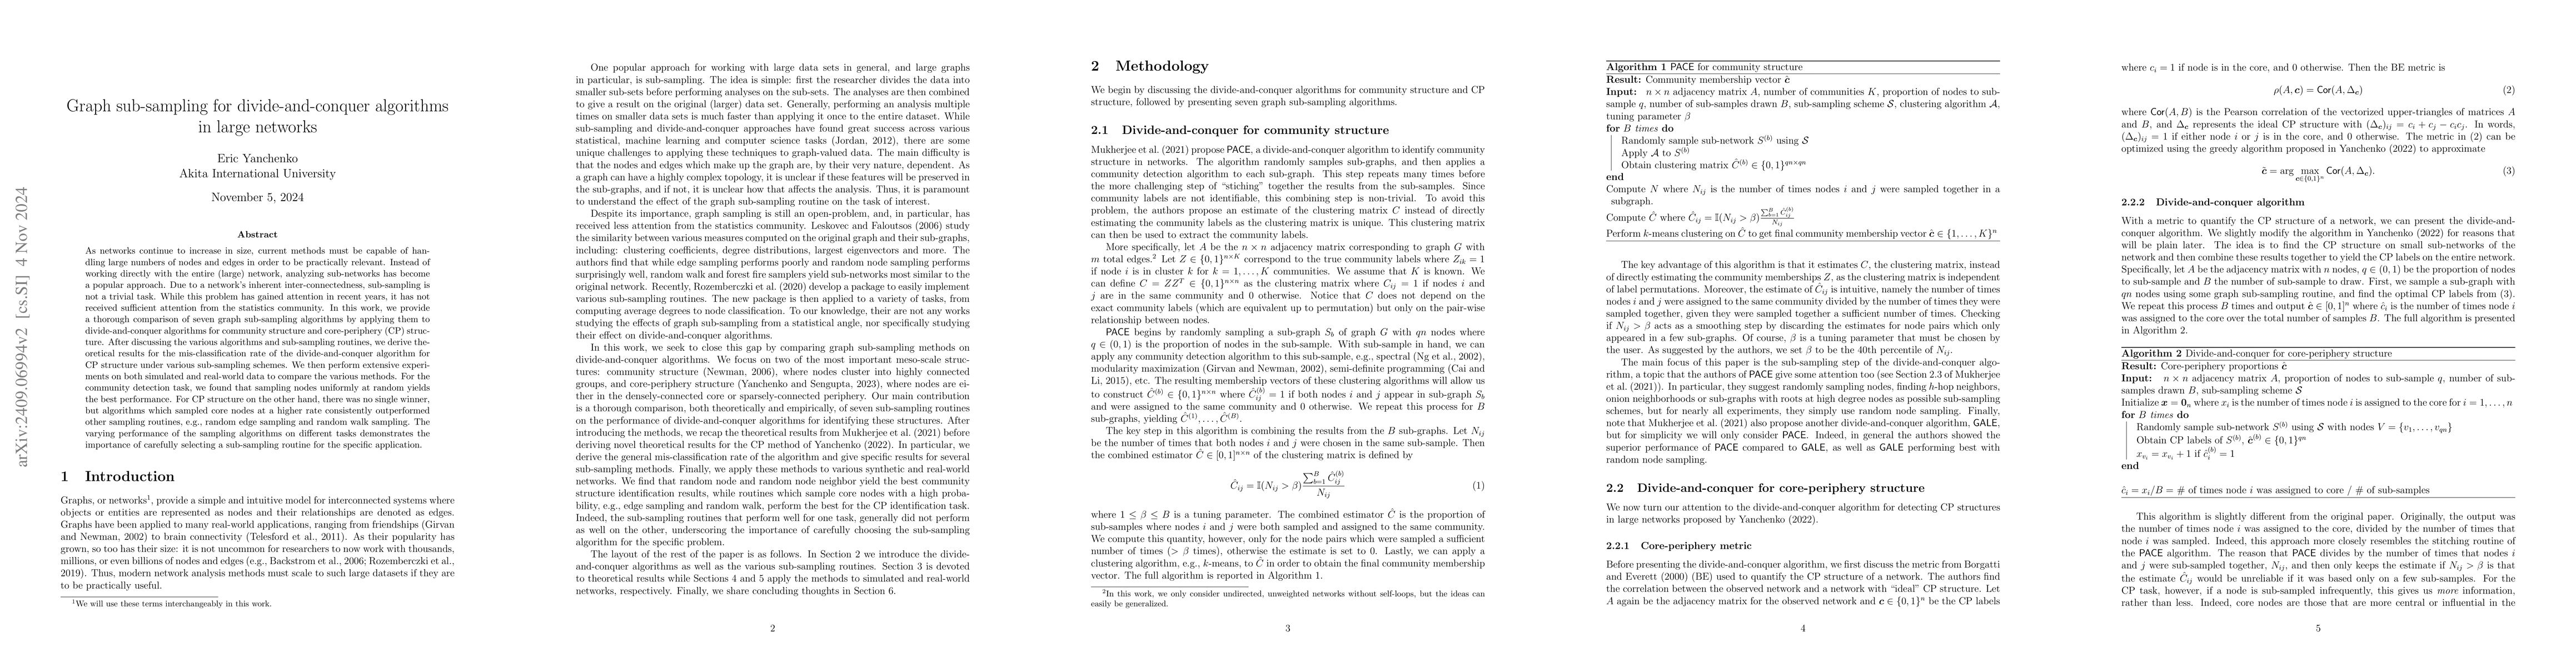
As networks continue to increase in size, current methods must be capable of handling large numbers of nodes and edges in order to be practically relevant. Instead of working directly with the entire (large) network, analyzing sub-networks has become a popular approach. Due to a network's inherent inter-connectedness, sub-sampling is not a trivial task. While this problem has gained attention in recent years, it has not received sufficient attention from the statistics community. In this work, we provide a thorough comparison of seven graph sub-sampling algorithms by applying them to divide-and-conquer algorithms for community structure and core-periphery (CP) structure. After discussing the various algorithms and sub-sampling routines, we derive theoretical results for the mis-classification rate of the divide-and-conquer algorithm for CP structure under various sub-sampling schemes. We then perform extensive experiments on both simulated and real-world data to compare the various methods. For the community detection task, we found that sampling nodes uniformly at random yields the best performance. For CP structure on the other hand, there was no single winner, but algorithms which sampled core nodes at a higher rate consistently outperformed other sampling routines, e.g., random edge sampling and random walk sampling. The varying performance of the sampling algorithms on different tasks demonstrates the importance of carefully selecting a sub-sampling routine for the specific application.
AI Key Findings
Get AI-generated insights about this paper's methodology, results, significance, and more — seven facets brought into focus.
Impact
Authors
PDF Preview
Citation Network
Current paper (gray), citations (green), references (blue)
Display is limited for performance on very large graphs.
Discussion 0