AI Quick Summary
This paper proposes a graph-time spectral analysis method using joint graph and short-time Fourier transform to study atrial fibrillation by incorporating spatial relations between epicardial electrograms. The analysis reveals reduced spatial variability and smoother ventricular activity during atrial fibrillation, and demonstrates its effectiveness in cancelling ventricular activity from atrial electrograms.
Quick Answers
What methodology did the authors use?
This study proposes a graph-time spectral analysis for atrial fibrillation, combining graph Fourier transform with short-time Fourier transform to analyze multi-electrode epicardial electrogram signals in a joint space of time and frequency domains. More in Methodology →
What are the key results?
Spatial variation of atrial electrograms decreases during atrial fibrillation due to the reduction of high temporal frequencies of atrial waves. — Ventricular activity is smoother over the atrial area compared to atrial activity. More in Key Results →
Why is this work significant?
This research introduces a novel approach using graph signal processing to analyze atrial fibrillation, addressing the complexities of physical models and providing a higher-level model for analysis. More in Significance →
What are the main limitations?
The initial challenge of constructing the most representative graph remains, with the current Euclidean-based nearest neighbor approach being a potential area for improvement. — The graph-based extraction algorithm involves a trade-off between preserving atrial activity and reducing ventricular activity, influenced by the smoothness upper bound in the optimization process. More in Limitations →
Abstract
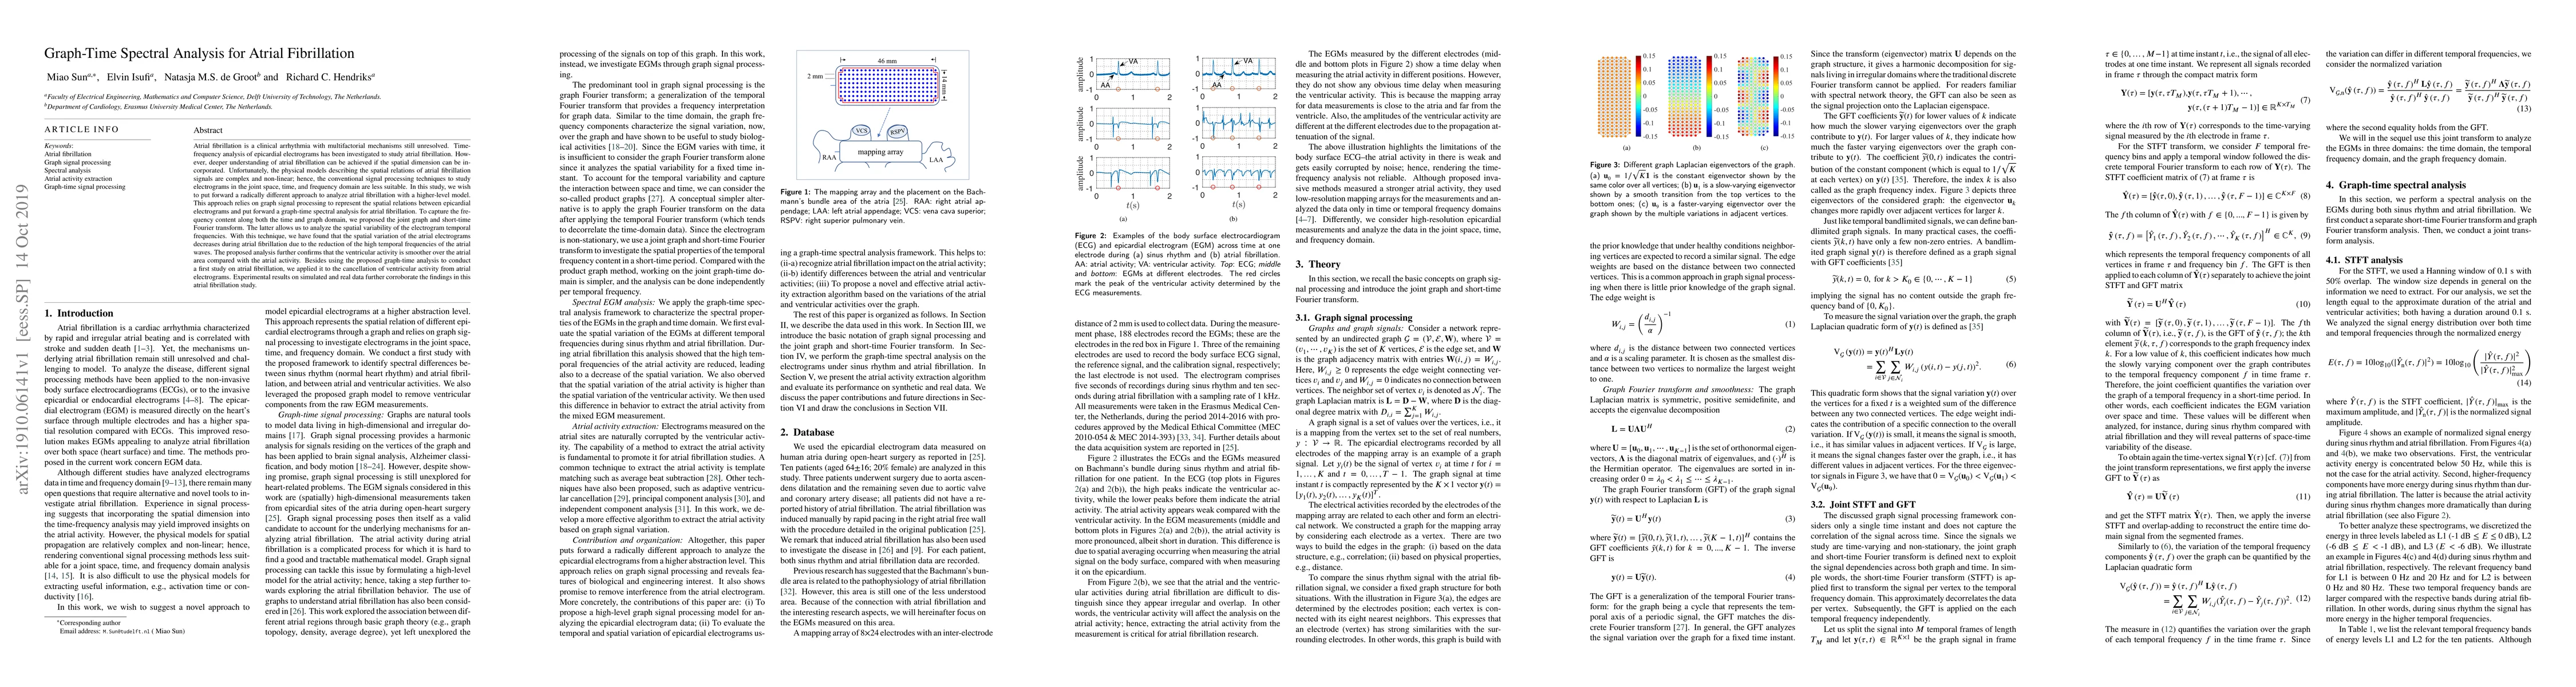
Atrial fibrillation is a clinical arrhythmia with multifactorial mechanisms still unresolved. Time-frequency analysis of epicardial electrograms has been investigated to study atrial fibrillation. However, deeper understanding of atrial fibrillation can be achieved if the spatial dimension can be incorporated. Unfortunately, the physical models describing the spatial relations of atrial fibrillation signals are complex and non-linear; hence, the conventional signal processing techniques to study electrograms in the joint space, time, and frequency domain are less suitable. In this study, we wish to put forward a radically different approach to analyze atrial fibrillation with a higher-level model. This approach relies on graph signal processing to represent the spatial relations between epicardial electrograms and put forward a graph-time spectral analysis for atrial fibrillation. To capture the frequency content along both the time and graph domain, we proposed the joint graph and short-time Fourier transform. The latter allows us to analyze the spatial variability of the electrogram temporal frequencies. With this technique, we have found that the spatial variation of the atrial electrograms decreases during atrial fibrillation due to the reduction of the high temporal frequencies of the atrial waves. The proposed analysis further confirms that the ventricular activity is smoother over the atrial area compared with the atrial activity. Besides using the proposed graph-time analysis to conduct a first study on atrial fibrillation, we applied it to the cancellation of ventricular activity from atrial electrograms. Experimental results on simulated and real data further corroborate the findings in this atrial fibrillation study.
AI Key Findings
Generated Sep 02, 2025
Methodology — What approach did the authors take?
This study proposes a graph-time spectral analysis for atrial fibrillation, combining graph Fourier transform with short-time Fourier transform to analyze multi-electrode epicardial electrogram signals in a joint space of time and frequency domains.
Key Results — What are the main findings?
- Spatial variation of atrial electrograms decreases during atrial fibrillation due to the reduction of high temporal frequencies of atrial waves.
- Ventricular activity is smoother over the atrial area compared to atrial activity.
- The proposed graph-time analysis outperforms other state-of-the-art methods in atrial activity extraction from mixed measurements.
- The method identifies a link between spatial and temporal variations of the atrial signal, leading to a reduction in spatial variation due to atrial fibrillation.
- High temporal variation induces high spatial variation in the atrial signal.
Significance — Why does this research matter?
This research introduces a novel approach using graph signal processing to analyze atrial fibrillation, addressing the complexities of physical models and providing a higher-level model for analysis.
Technical Contribution — What is the technical contribution?
The paper presents a novel graph-time spectral analysis for atrial fibrillation, combining graph Fourier transform with short-time Fourier transform to analyze multi-electrode epicardial electrogram signals in a joint space of time and frequency domains.
Novelty — What is new about this work?
The approach is novel as it leverages graph signal processing, a recent research area in signal processing, to model electrograms during atrial fibrillation with a higher-level model, overcoming difficulties in analyzing the disease through complicated physical models.
Limitations — What are the limitations of this study?
- The initial challenge of constructing the most representative graph remains, with the current Euclidean-based nearest neighbor approach being a potential area for improvement.
- The graph-based extraction algorithm involves a trade-off between preserving atrial activity and reducing ventricular activity, influenced by the smoothness upper bound in the optimization process.
Future Work — What did the authors propose for future work?
- Investigate the use of graph learning techniques to find a more meaningful graph structure.
- Explore the potential of directed graphs and other graph representation matrices for different insights into atrial fibrillation.
- Corroborate findings on a larger dataset with induced and spontaneous atrial fibrillation to characterize graph-time spectral behavior of the disease levels.
- Adopt graph-based techniques to detect atrial fibrillation triggers from electrogram measurements.
Paper Details
How to Cite This Paper
@article{isufi2019graph,
title = {Graph-Time Spectral Analysis for Atrial Fibrillation},
author = {Isufi, Elvin and Sun, Miao and Groot, Natasja M. S. de and others},
year = {2019},
eprint = {1910.06141},
archivePrefix = {arXiv},
primaryClass = {eess.SP},
}
Isufi, E., Sun, M., Groot, N., & Hendriks, R. (2019). Graph-Time Spectral Analysis for Atrial Fibrillation. arXiv. https://arxiv.org/abs/1910.06141
Isufi, Elvin, et al. "Graph-Time Spectral Analysis for Atrial Fibrillation." arXiv, 2019, arxiv.org/abs/1910.06141.
PDF Preview
Key Terms
Citation Network
Current paper (gray), citations (green), references (blue)
Display is limited for performance on very large graphs.
Similar Papers
Found 4 papersThe 'Atrial Fibrillation Better Care' (ABC) pathway for integrated care of Atrial Fibrillation: A Systematic Review and Meta-Analysis.
Romiti, Giulio Francesco, Tokmakova, Mariya, Bucci, Tommaso et al.
Analysis of ECG data to detect Atrial Fibrillation
Arjun Sridharkumar, Sai Bhargav, Rahul Guntha
Medical Image Analysis on Left Atrial LGE MRI for Atrial Fibrillation Studies: A Review
Xiahai Zhuang, Lei Li, Veronika A. Zimmer et al.
| Title | Authors | Year | Actions |
|---|
Comments (0)