Publication
Metrics
AI Quick Summary
The methods offer a balance between stringent criteria like the familywise error rate and low power procedures, making them suitable for exploratory trial settings.
Paper Preview
Abstract
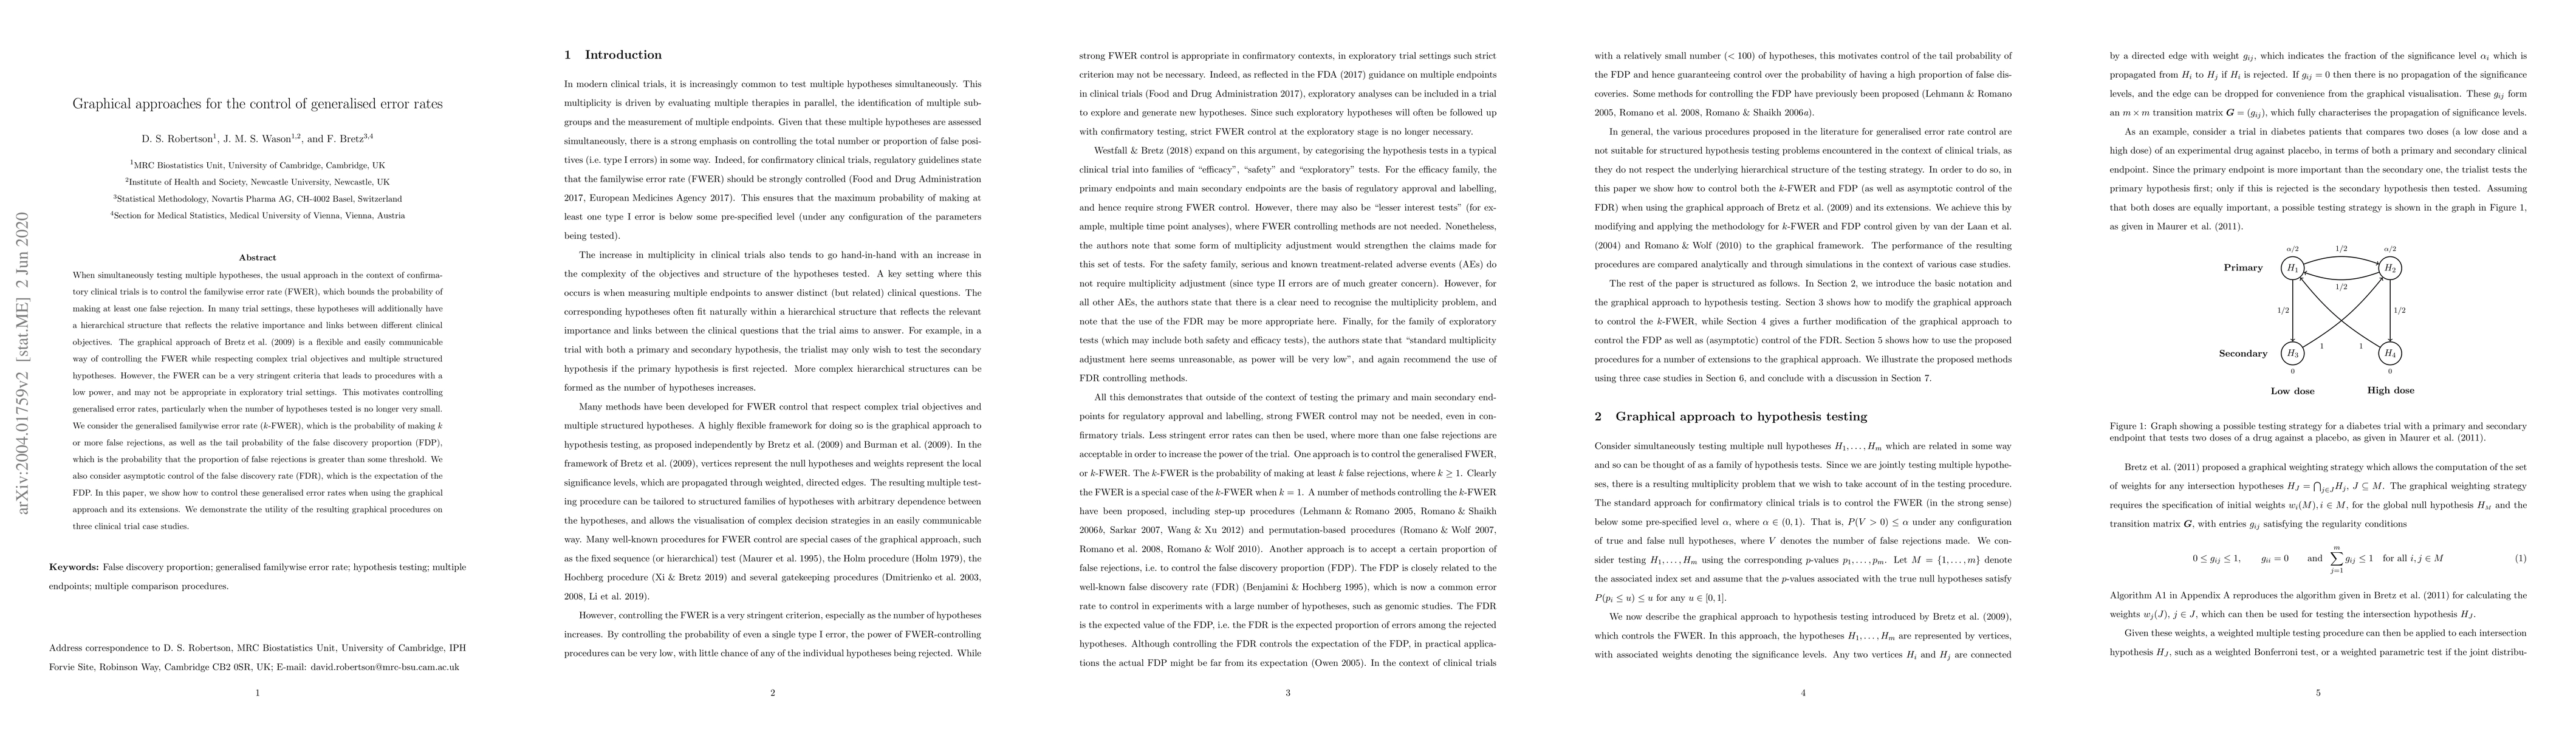
When simultaneously testing multiple hypotheses, the usual approach in the context of confirmatory clinical trials is to control the familywise error rate (FWER), which bounds the probability of making at least one false rejection. In many trial settings, these hypotheses will additionally have a hierarchical structure that reflects the relative importance and links between different clinical objectives. The graphical approach of Bretz et al. (2009) is a flexible and easily communicable way of controlling the FWER while respecting complex trial objectives and multiple structured hypotheses. However, the FWER can be a very stringent criterion that leads to procedures with low power, and may not be appropriate in exploratory trial settings. This motivates controlling generalised error rates, particularly when the number of hypotheses tested is no longer small. We consider the generalised familywise error rate (k-FWER), which is the probability of making k or more false rejections, as well as the tail probability of the false discovery proportion (FDP), which is the probability that the proportion of false rejections is greater than some threshold. We also consider asymptotic control of the false discovery rate (FDR), which is the expectation of the FDP. In this paper, we show how to control these generalised error rates when using the graphical approach and its extensions. We demonstrate the utility of the resulting graphical procedures on three clinical trial case studies.
AI Key Findings
Get AI-generated insights about this paper's methodology, results, significance, and more — seven facets brought into focus.
Impact
Paper Details
Authors
PDF Preview
Key Terms
Citation Network
Current paper (gray), citations (green), references (blue)
Display is limited for performance on very large graphs.
Discussion 0