Graphical description of Pauli measurements on stabilizer states
Publication
Metrics
AI Quick Summary
This paper presents a graphical method to describe the outcomes of Pauli measurements on stabilizer states, building on previous work that depicted Clifford operations on these states. The graphical representation simplifies the understanding and application of Pauli product measurements.
Paper Preview
Abstract
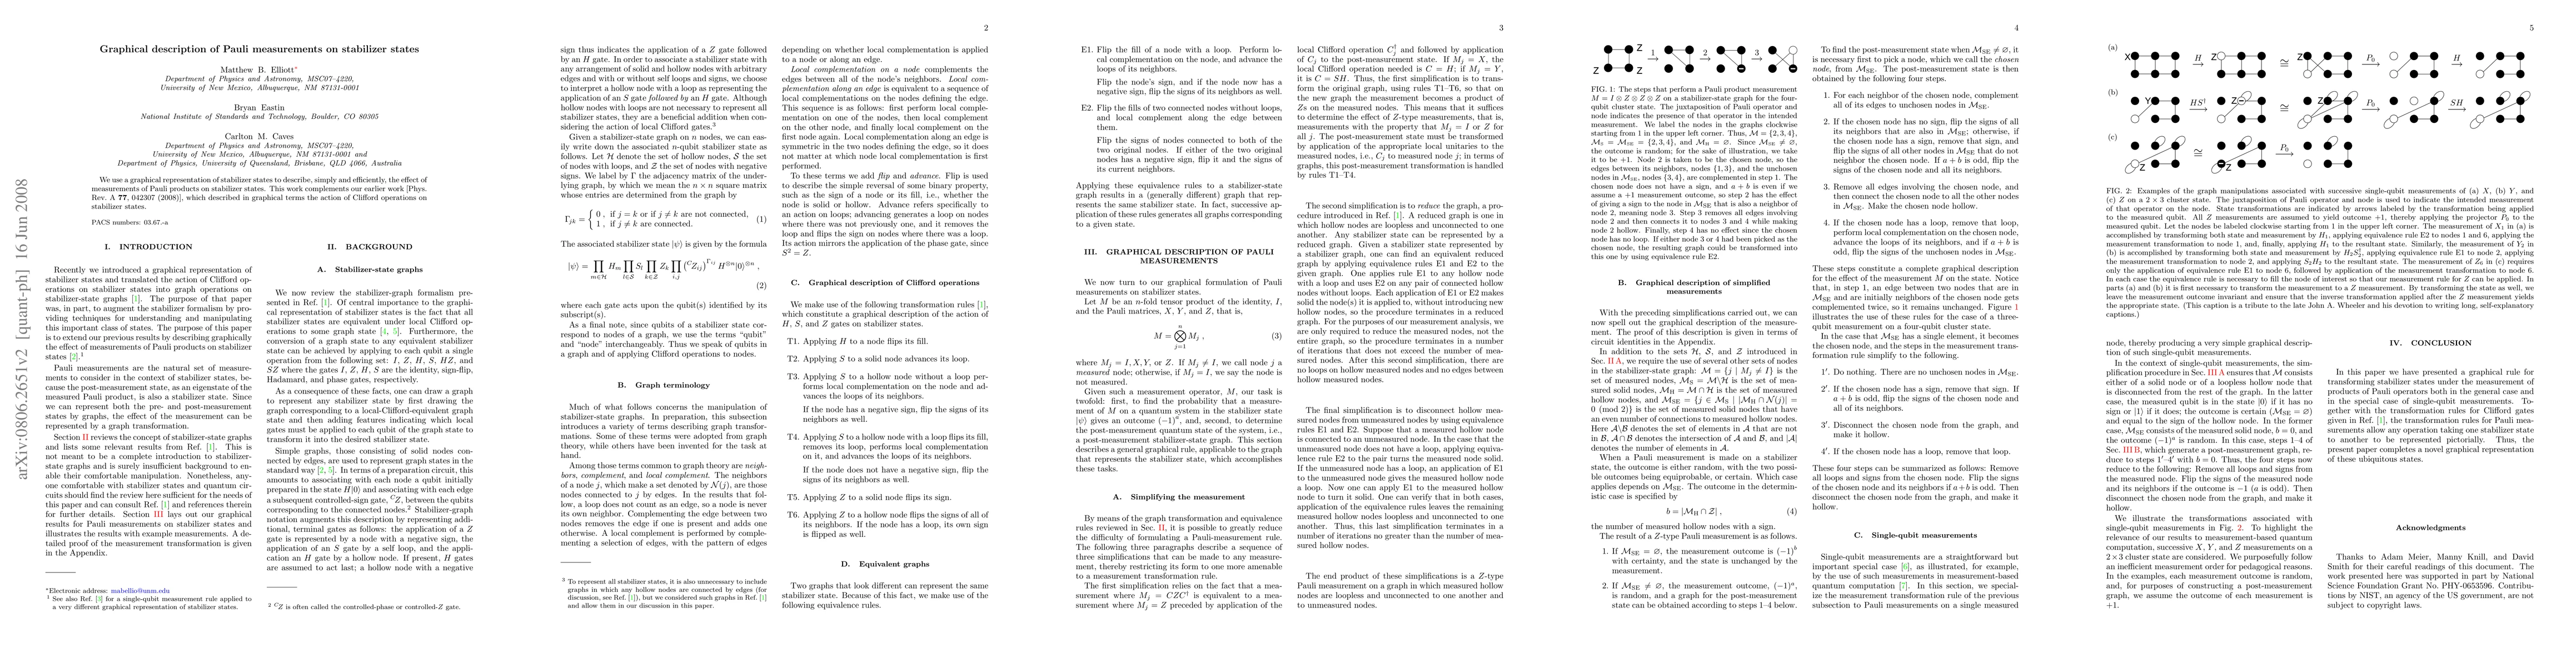
We use a graphical representation of stabilizer states to describe, simply and efficiently, the effect of measurements of Pauli products on stabilizer states. This work complements our earlier work [Phys. Rev. A 77, 042307 (2008)], which described in graphical terms the action of Clifford operations on stabilizer states.
AI Key Findings
Get AI-generated insights about this paper's methodology, results, significance, and more — seven facets brought into focus.
Impact
Paper Details
PDF Preview
Key Terms
Citation Network
Current paper (gray), citations (green), references (blue)
Display is limited for performance on very large graphs.
Discussion 0