Publication
Metrics
AI Quick Summary
This paper explores the integration of external network data into Gaussian graphical models to understand dependencies between variables in social media connectedness and COVID-19 evolution, and stock market returns. The study develops spike-and-slab and graphical LASSO frameworks to enhance inference and interpretation, revealing stronger associations in stock market returns linked to economic indicators.
Paper Preview
Abstract
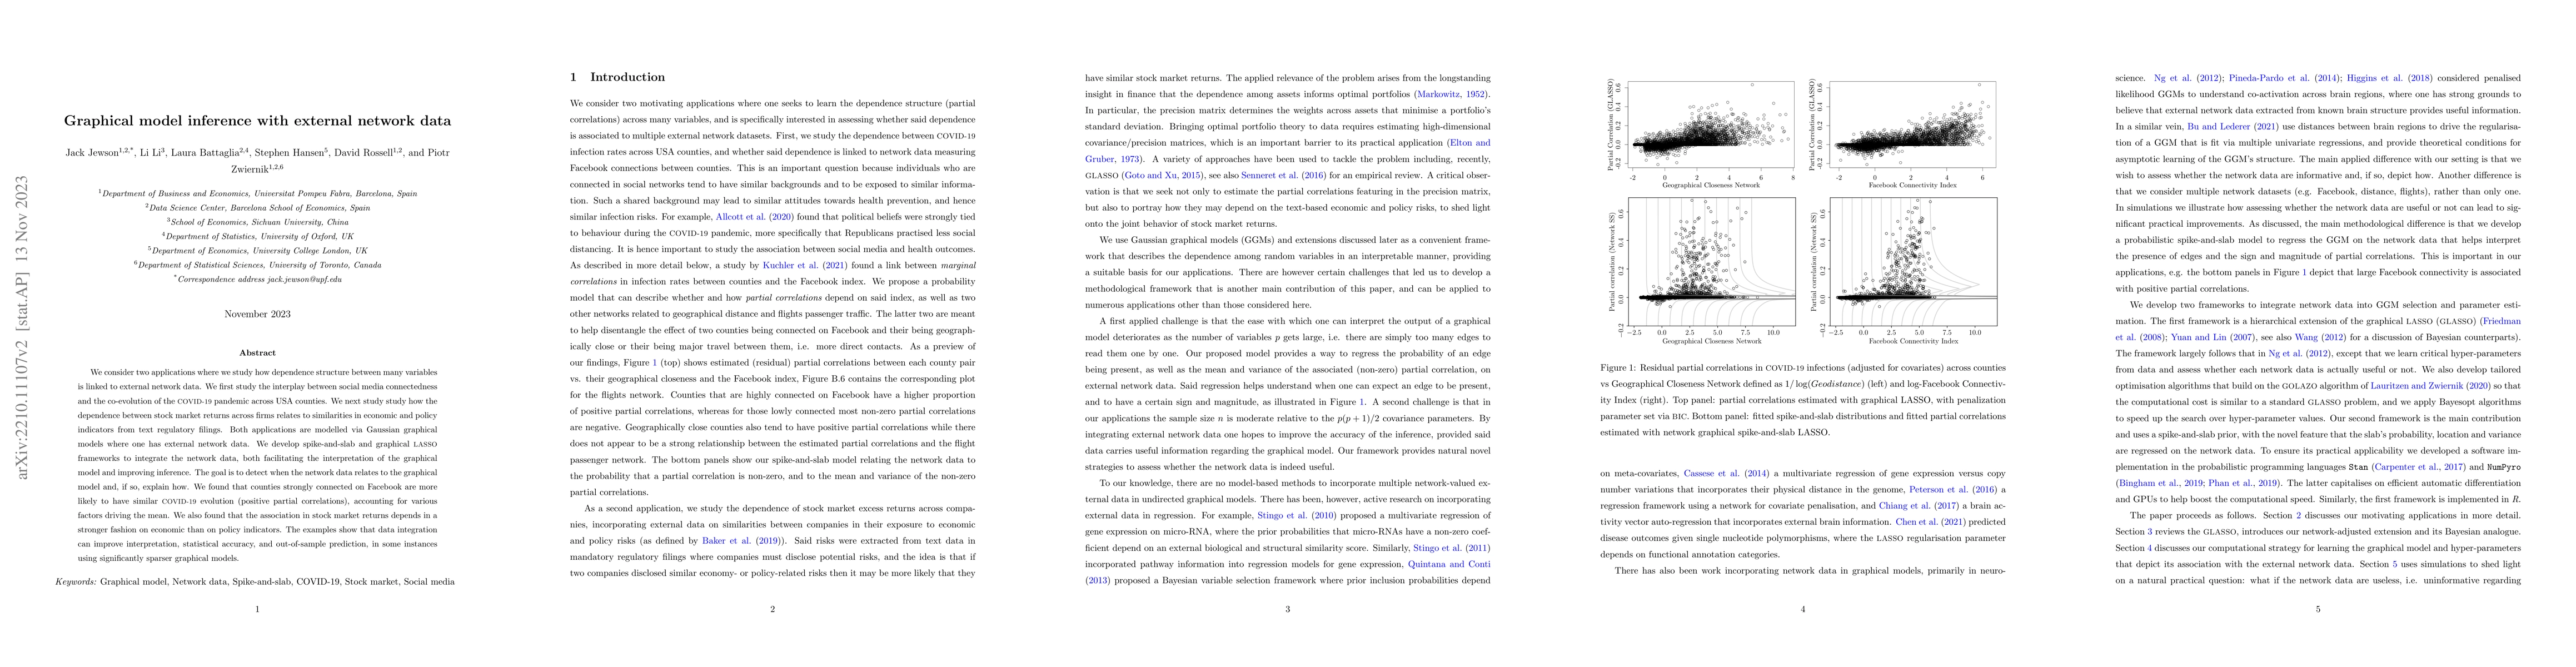
We consider two applications where we study how dependence structure between many variables is linked to external network data. We first study the interplay between social media connectedness and the co-evolution of the COVID-19 pandemic across USA counties. We next study study how the dependence between stock market returns across firms relates to similarities in economic and policy indicators from text regulatory filings. Both applications are modelled via Gaussian graphical models where one has external network data. We develop spike-and-slab and graphical LASSO frameworks to integrate the network data, both facilitating the interpretation of the graphical model and improving inference. The goal is to detect when the network data relates to the graphical model and, if so, explain how. We found that counties strongly connected on Facebook are more likely to have similar COVID-19 evolution (positive partial correlations), accounting for various factors driving the mean. We also found that the association in stock market returns depends in a stronger fashion on economic than on policy indicators. The examples show that data integration can improve interpretation, statistical accuracy, and out-of-sample prediction, in some instances using significantly sparser graphical models.
AI Key Findings
Get AI-generated insights about this paper's methodology, results, significance, and more — seven facets brought into focus.
Impact
Paper Details
Authors
PDF Preview
Key Terms
Citation Network
Current paper (gray), citations (green), references (blue)
Display is limited for performance on very large graphs.
Discussion 0