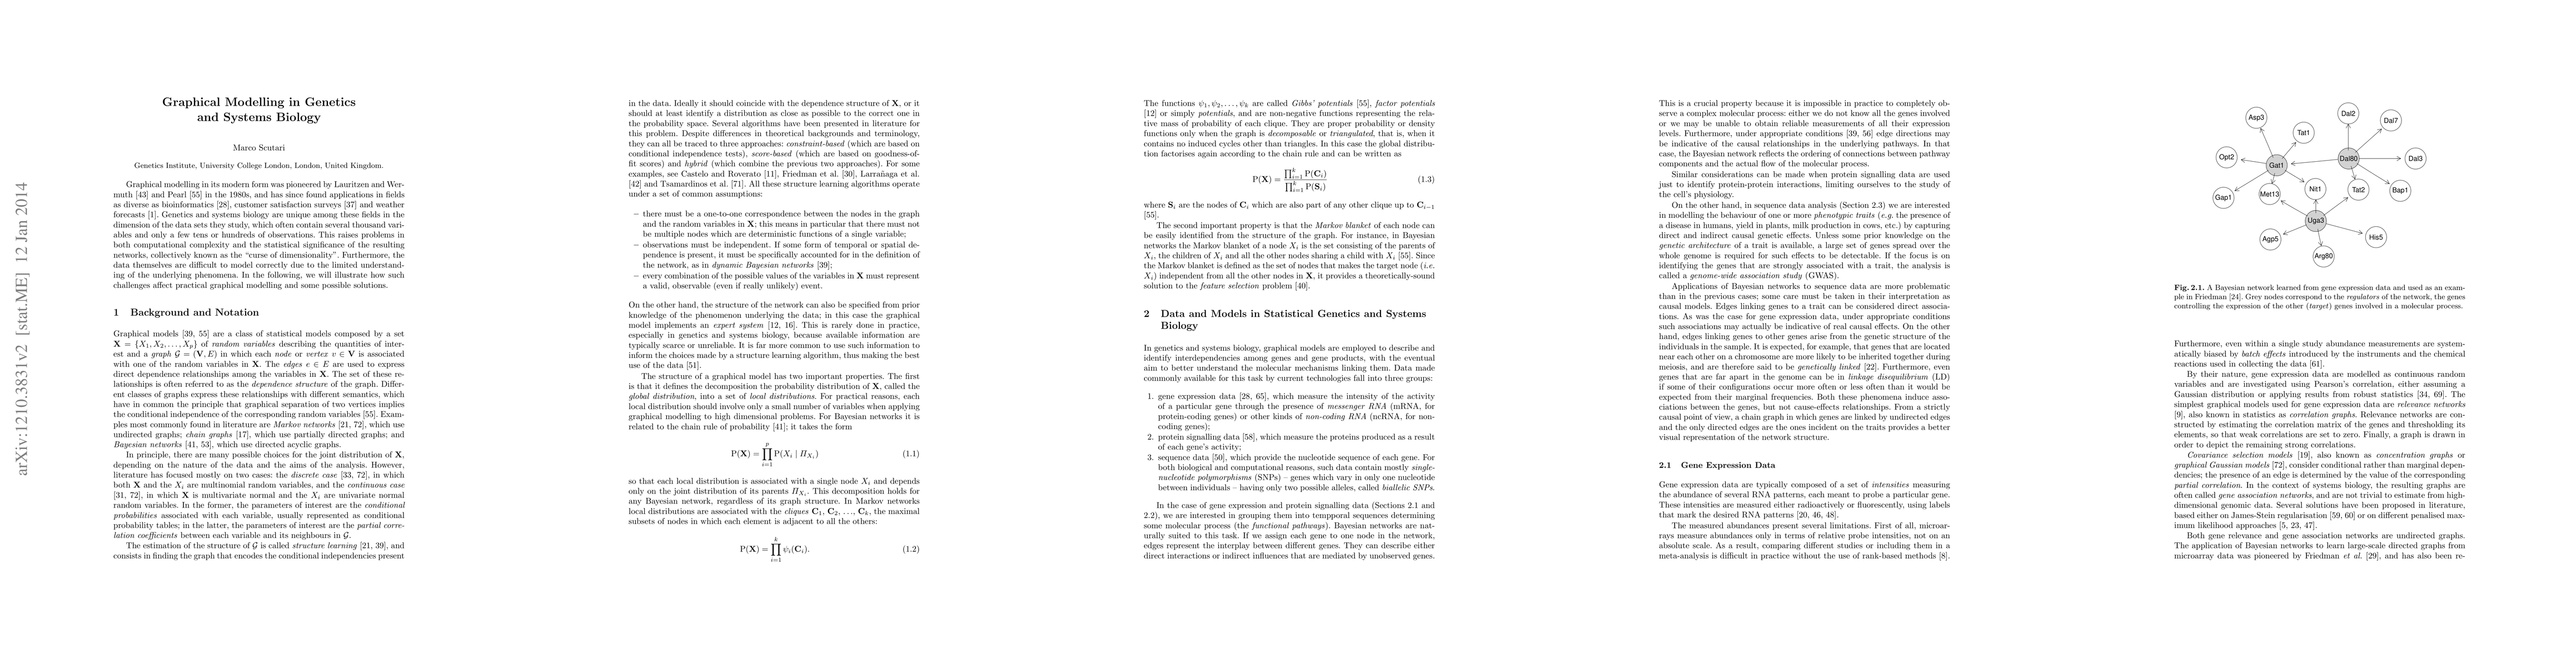
Publication
Metrics
AI Quick Summary
This paper explores the application of graphical modelling in genetics and systems biology, highlighting the challenges posed by high-dimensional data and the "curse of dimensionality." It discusses potential solutions to these issues to improve the analysis and interpretation of complex biological networks.
Paper Preview
Abstract
Graphical modelling has a long history in statistics as a tool for the analysis of multivariate data, starting from Wright's path analysis and Gibbs' applications to statistical physics at the beginning of the last century. In its modern form, it was pioneered by Lauritzen and Wermuth and Pearl in the 1980s, and has since found applications in fields as diverse as bioinformatics, customer satisfaction surveys and weather forecasts. Genetics and systems biology are unique among these fields in the dimension of the data sets they study, which often contain several hundreds of variables and only a few tens or hundreds of observations. This raises problems in both computational complexity and the statistical significance of the resulting networks, collectively known as the "curse of dimensionality". Furthermore, the data themselves are difficult to model correctly due to the limited understanding of the underlying mechanisms. In the following, we will illustrate how such challenges affect practical graphical modelling and some possible solutions.
AI Key Findings
Get AI-generated insights about this paper's methodology, results, significance, and more — seven facets brought into focus.
Impact
Paper Details
PDF Preview
Key Terms
Citation Network
Current paper (gray), citations (green), references (blue)
Display is limited for performance on very large graphs.
Discussion 0