Publication
Metrics
AI Quick Summary
This paper proposes a graphical model for correlated defaults using algebraic geometry techniques, demonstrating its ability to represent any marginal distribution and pairwise correlation matrix, and introduces a calibration algorithm based on maximum likelihood estimation. It compares this model to the standard normal copula model, focusing on loss distribution tails and implied correlation smile.
Paper Preview
Abstract
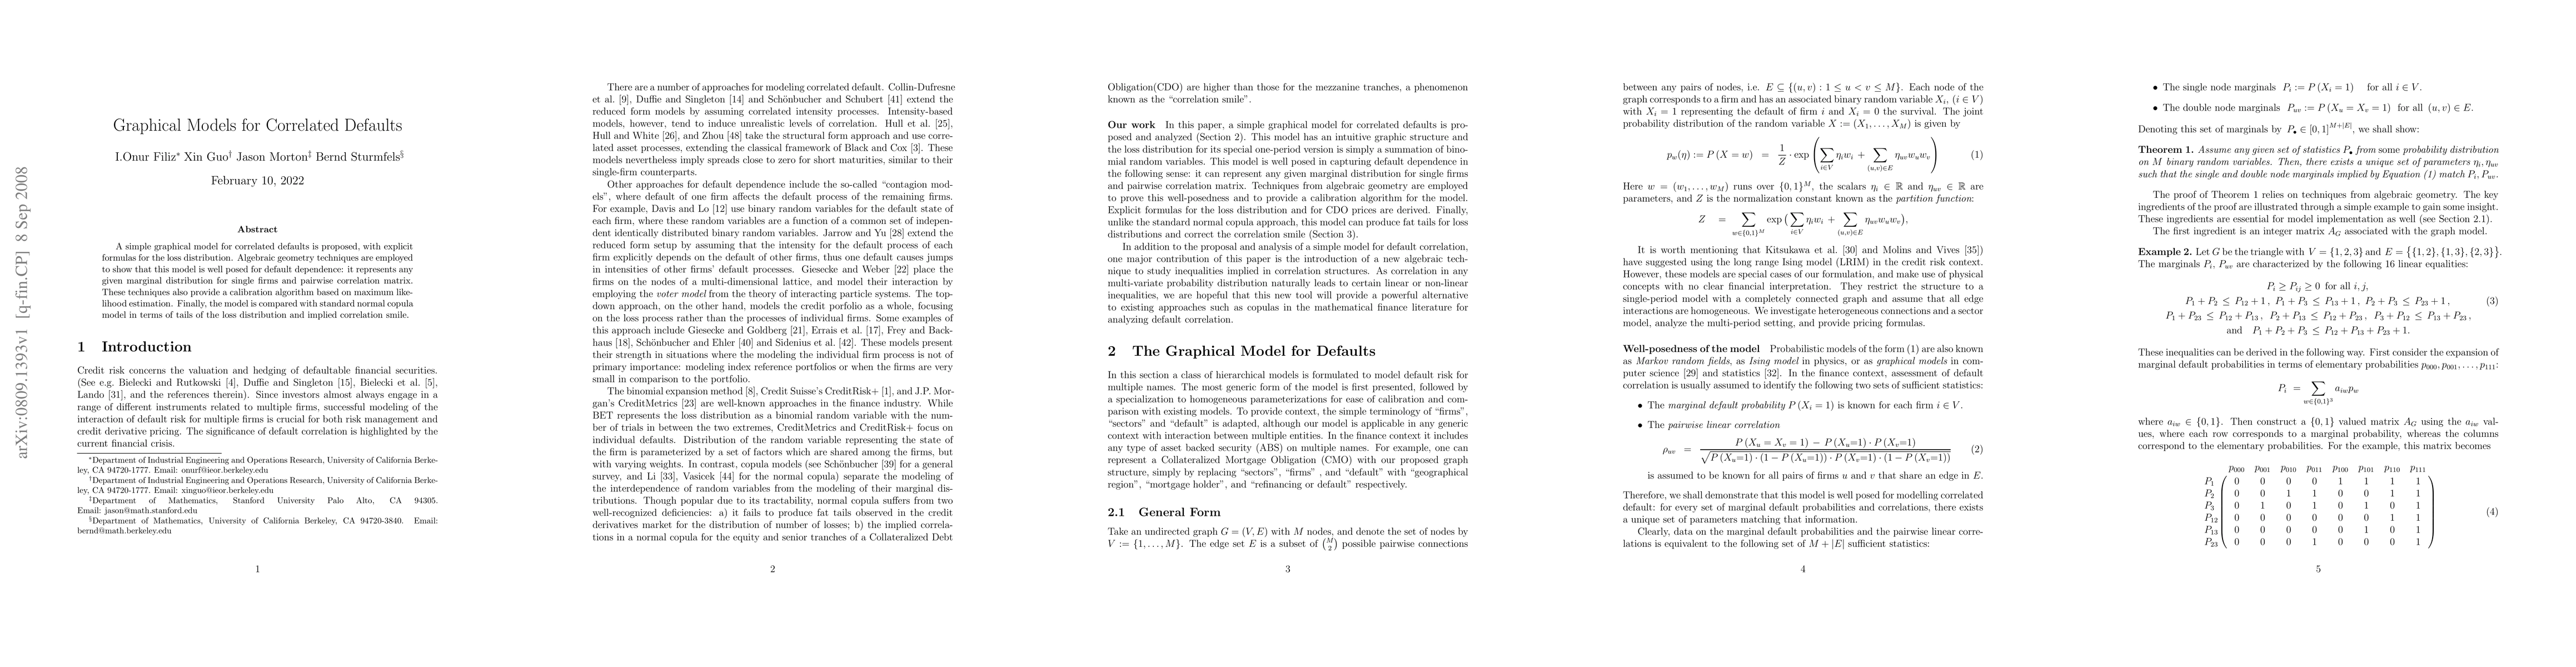
A simple graphical model for correlated defaults is proposed, with explicit formulas for the loss distribution. Algebraic geometry techniques are employed to show that this model is well posed for default dependence: it represents any given marginal distribution for single firms and pairwise correlation matrix. These techniques also provide a calibration algorithm based on maximum likelihood estimation. Finally, the model is compared with standard normal copula model in terms of tails of the loss distribution and implied correlation smile.
AI Key Findings
Get AI-generated insights about this paper's methodology, results, significance, and more — seven facets brought into focus.
Impact
Paper Details
PDF Preview
Key Terms
Citation Network
Current paper (gray), citations (green), references (blue)
Display is limited for performance on very large graphs.
Discussion 0