Graphical Models for Inference Under Outcome-Dependent Sampling
Publication
Metrics
AI Quick Summary
This paper explores graphical models for inference in outcome-dependent sampling scenarios, such as case-control studies, by explicitly incorporating a sampling indicator node. It provides conditions for consistent estimation of exposure-outcome associations and sufficient graphical criteria for causal effect testing and estimation, illustrated through practical examples.
Paper Preview
Abstract
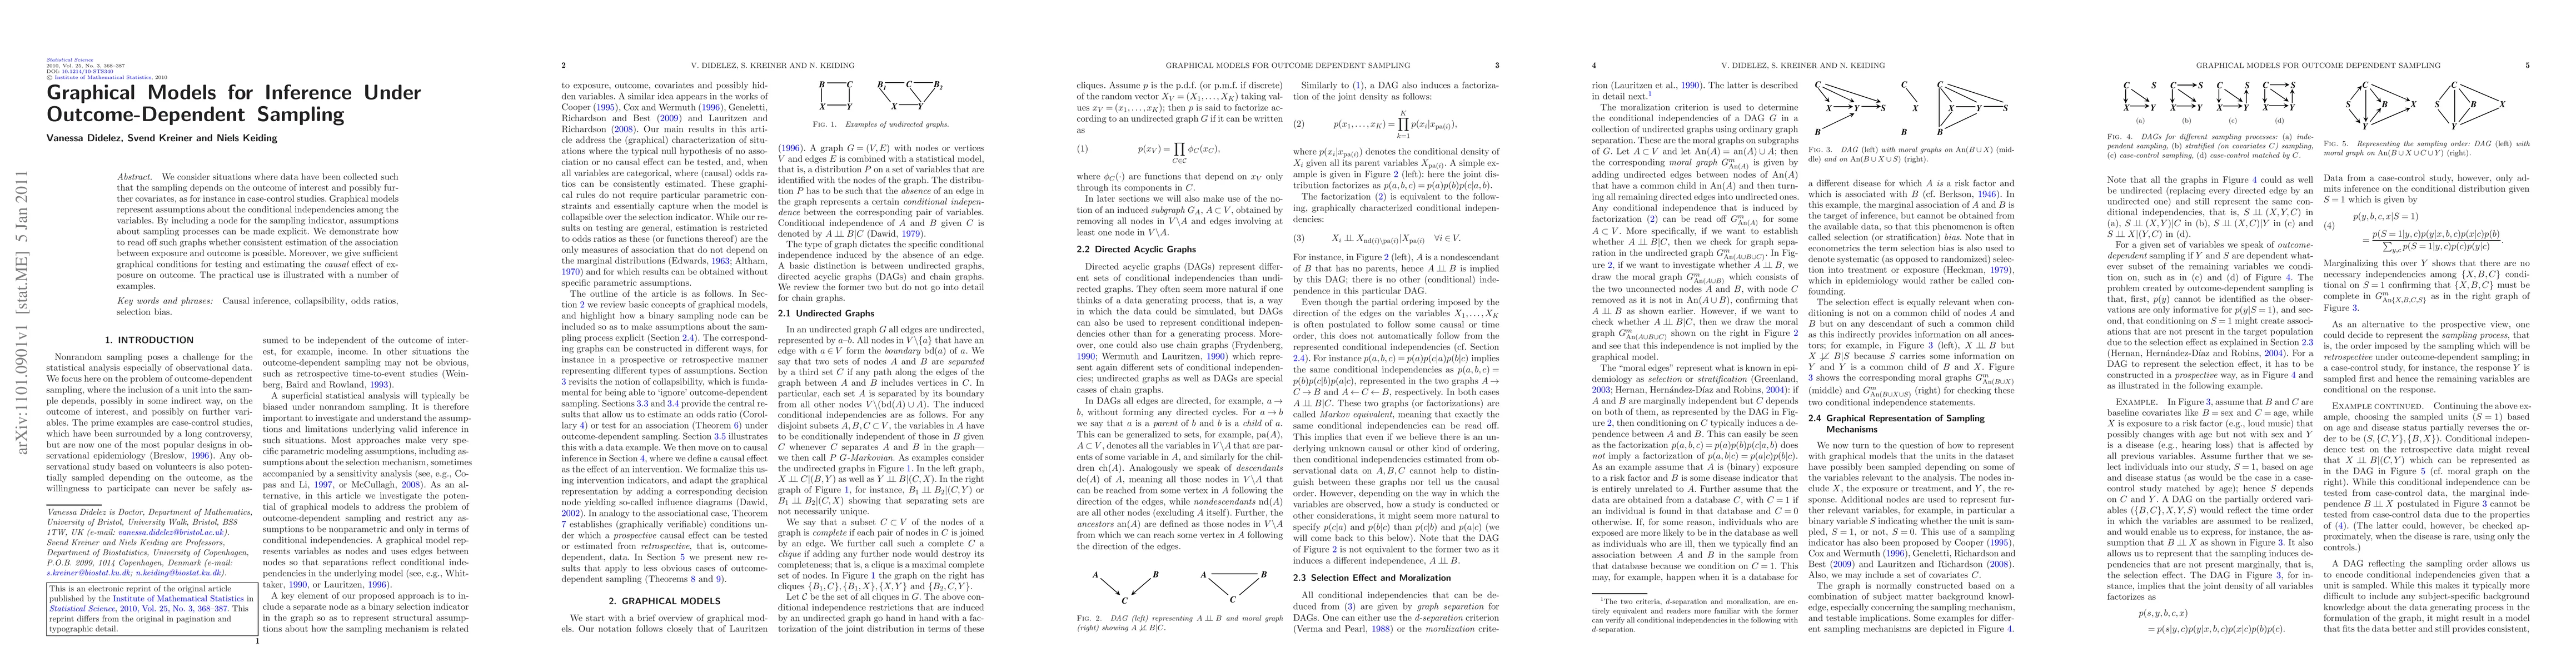
We consider situations where data have been collected such that the sampling depends on the outcome of interest and possibly further covariates, as for instance in case-control studies. Graphical models represent assumptions about the conditional independencies among the variables. By including a node for the sampling indicator, assumptions about sampling processes can be made explicit. We demonstrate how to read off such graphs whether consistent estimation of the association between exposure and outcome is possible. Moreover, we give sufficient graphical conditions for testing and estimating the causal effect of exposure on outcome. The practical use is illustrated with a number of examples.
AI Key Findings
Get AI-generated insights about this paper's methodology, results, significance, and more — seven facets brought into focus.
Impact
Paper Details
PDF Preview
Key Terms
Citation Network
Current paper (gray), citations (green), references (blue)
Display is limited for performance on very large graphs.
Discussion 0