Publication
Metrics
AI Quick Summary
This paper explores the use of graphical models, specifically variational Bayesian expectation maximization (VBEM), for analyzing single-molecule biophysics data, exemplified by single-molecule fluorescence resonance energy transfer (smFRET). The VBEM algorithm provides a metric for model selection and parameter estimation, offering advantages over traditional maximum likelihood methods.
Paper Preview
Abstract
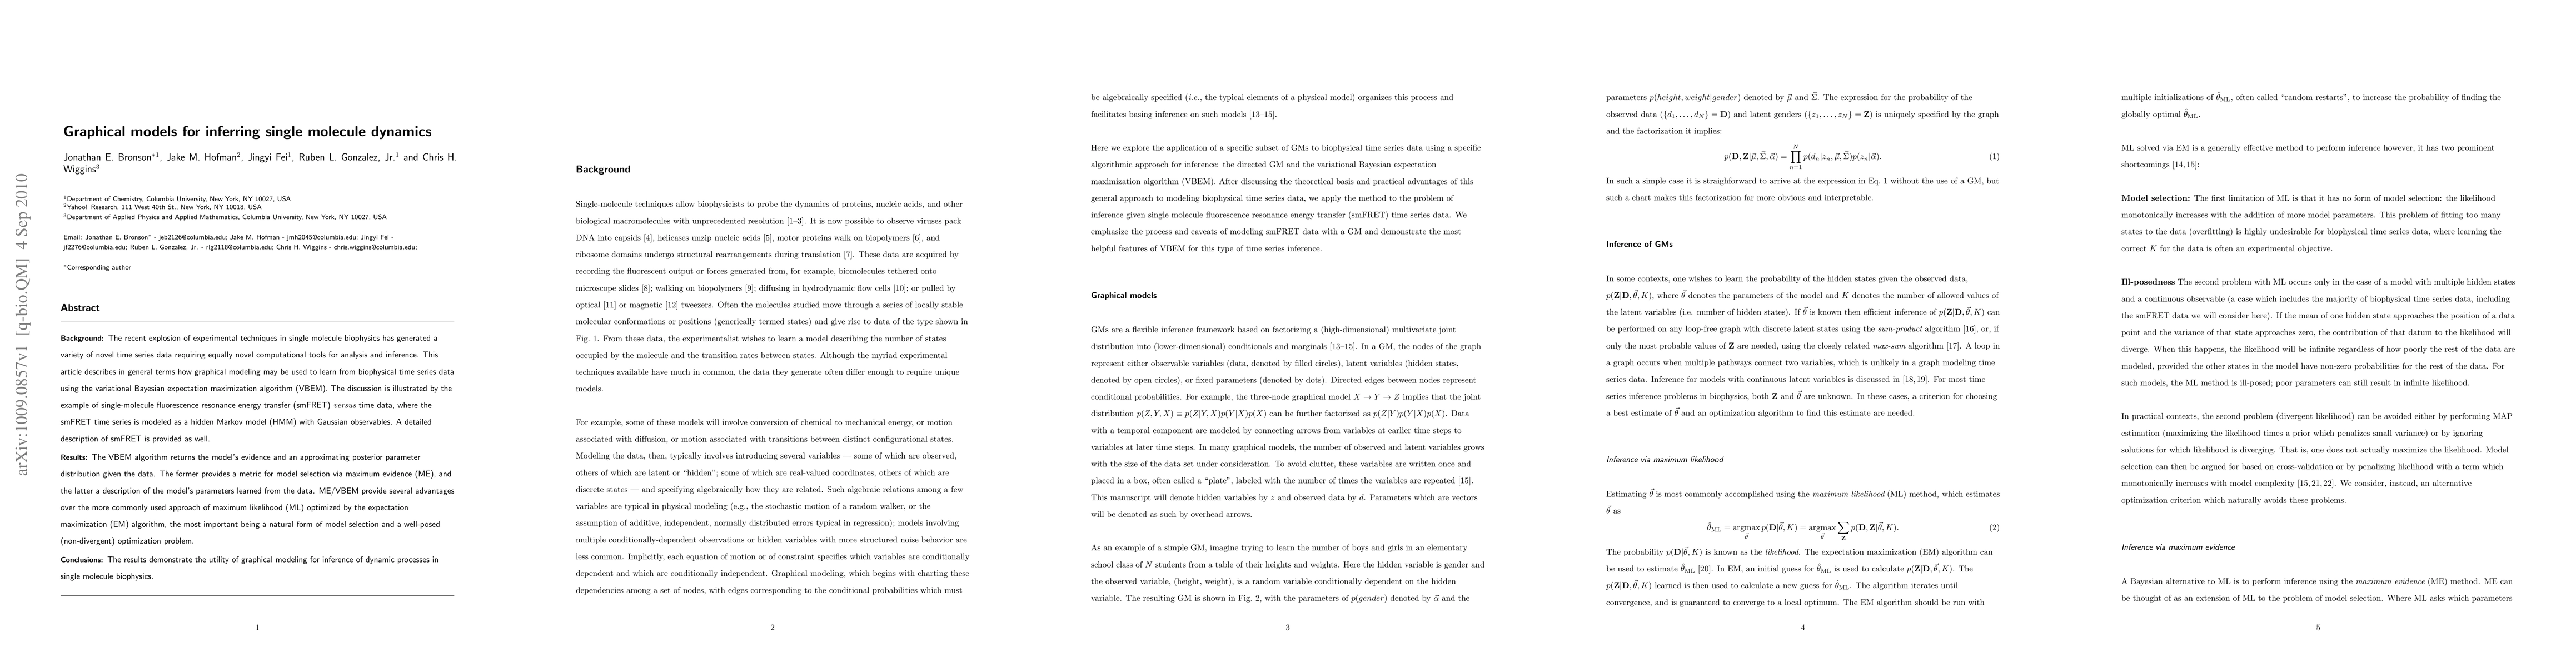
Background: The recent explosion of experimental techniques in single molecule biophysics has generated a variety of novel time series data requiring equally novel computational tools for analysis and inference. This article describes in general terms how graphical modeling may be used to learn from biophysical time series data using the variational Bayesian expectation maximization algorithm (VBEM). The discussion is illustrated by the example of single-molecule fluorescence resonance energy transfer (smFRET) versus time data, where the smFRET time series is modeled as a hidden Markov model (HMM) with Gaussian observables. A detailed description of smFRET is provided as well. Results: The VBEM algorithm returns the model's evidence and an approximating posterior parameter distribution given the data. The former provides a metric for model selection via maximum evidence (ME), and the latter a description of the model's parameters learned from the data. ME/VBEM provide several advantages over the more commonly used approach of maximum likelihood (ML) optimized by the expectation maximization (EM) algorithm, the most important being a natural form of model selection and a well-posed (non-divergent) optimization problem. Conclusions: The results demonstrate the utility of graphical modeling for inference of dynamic processes in single molecule biophysics.
AI Key Findings
Get AI-generated insights about this paper's methodology, results, significance, and more — seven facets brought into focus.
Impact
Paper Details
PDF Preview
Key Terms
Citation Network
Current paper (gray), citations (green), references (blue)
Display is limited for performance on very large graphs.
Discussion 0