Graphical tools for model-based mixture discriminant analysis
Publication
Metrics
AI Quick Summary
This paper presents a graphical methodology for visualizing the classification structure of Gaussian mixture models in reduced dimensions, focusing on the geometric characteristics and discriminant directions that maximize class separation. The approach extends existing dimensionality reduction techniques for model-based clustering.
Paper Preview
Abstract
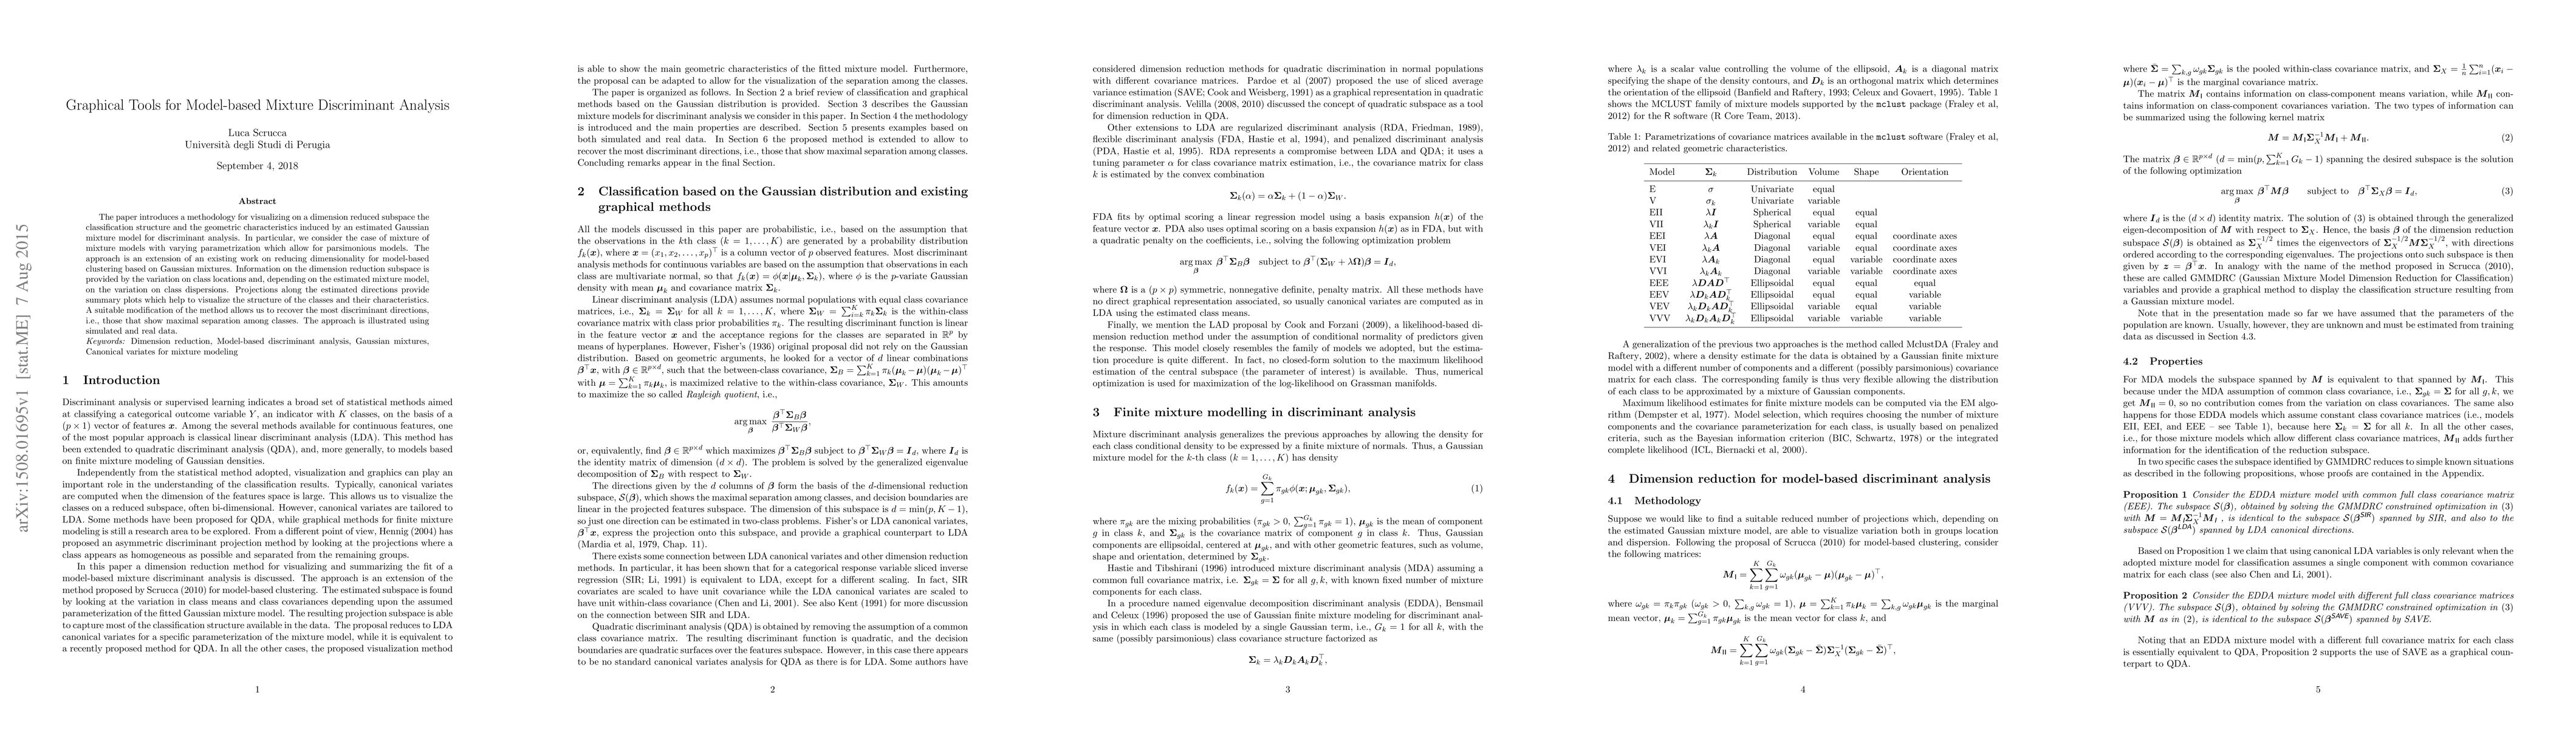
The paper introduces a methodology for visualizing on a dimension reduced subspace the classification structure and the geometric characteristics induced by an estimated Gaussian mixture model for discriminant analysis. In particular, we consider the case of mixture of mixture models with varying parametrization which allow for parsimonious models. The approach is an extension of an existing work on reducing dimensionality for model-based clustering based on Gaussian mixtures. Information on the dimension reduction subspace is provided by the variation on class locations and, depending on the estimated mixture model, on the variation on class dispersions. Projections along the estimated directions provide summary plots which help to visualize the structure of the classes and their characteristics. A suitable modification of the method allows us to recover the most discriminant directions, i.e., those that show maximal separation among classes. The approach is illustrated using simulated and real data.
AI Key Findings
Get AI-generated insights about this paper's methodology, results, significance, and more — seven facets brought into focus.
Impact
Paper Details
PDF Preview
Key Terms
Citation Network
Current paper (gray), citations (green), references (blue)
Display is limited for performance on very large graphs.
Discussion 0