Graphlets over Time: A New Lens for Temporal Network Analysis
Publication
Metrics
AI Quick Summary
This paper introduces a novel approach to temporal network analysis by examining the evolution of graphlet distributions over time in real-world graphs. It reveals distinct evolution patterns in real graphs compared to random graphs and uses graphlet transition graphs to measure similarity across domains. Additionally, it shows that early local structures around nodes and edges strongly predict their future importance.
Paper Preview
Abstract
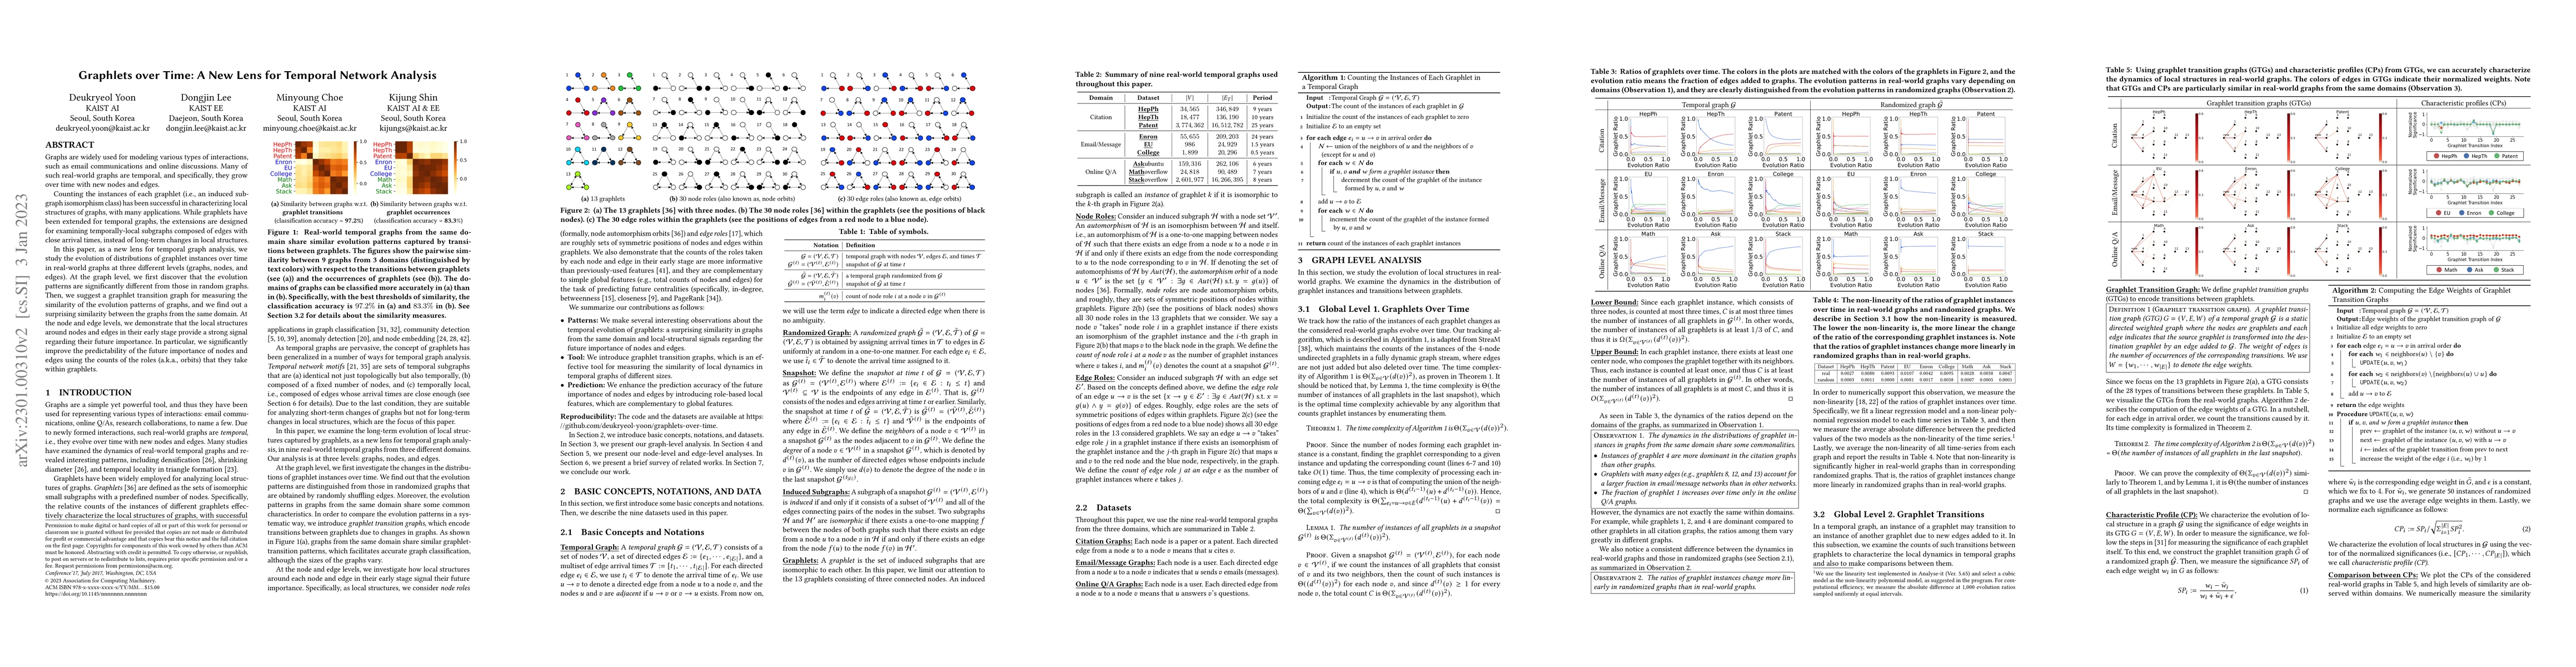
Graphs are widely used for modeling various types of interactions, such as email communications and online discussions. Many of such real-world graphs are temporal, and specifically, they grow over time with new nodes and edges. Counting the instances of each graphlet (i.e., an induced subgraph isomorphism class) has been successful in characterizing local structures of graphs, with many applications. While graphlets have been extended for temporal graphs, the extensions are designed for examining temporally-local subgraphs composed of edges with close arrival times, instead of long-term changes in local structures. In this paper, as a new lens for temporal graph analysis, we study the evolution of distributions of graphlet instances over time in real-world graphs at three different levels (graphs, nodes, and edges). At the graph level, we first discover that the evolution patterns are significantly different from those in random graphs. Then, we suggest a graphlet transition graph for measuring the similarity of the evolution patterns of graphs, and we find out a surprising similarity between the graphs from the same domain. At the node and edge levels, we demonstrate that the local structures around nodes and edges in their early stage provide a strong signal regarding their future importance. In particular, we significantly improve the predictability of the future importance of nodes and edges using the counts of the roles (a.k.a., orbits) that they take within graphlets.
AI Key Findings
Get AI-generated insights about this paper's methodology, results, significance, and more — seven facets brought into focus.
Impact
Paper Details
Authors
PDF Preview
Key Terms
Citation Network
Current paper (gray), citations (green), references (blue)
Display is limited for performance on very large graphs.
Discussion 0