GraphStateVis: Interactive Visual Analysis of Qubit Graph States and their Stabilizer Groups
Publication
Metrics
Paper Preview
Abstract
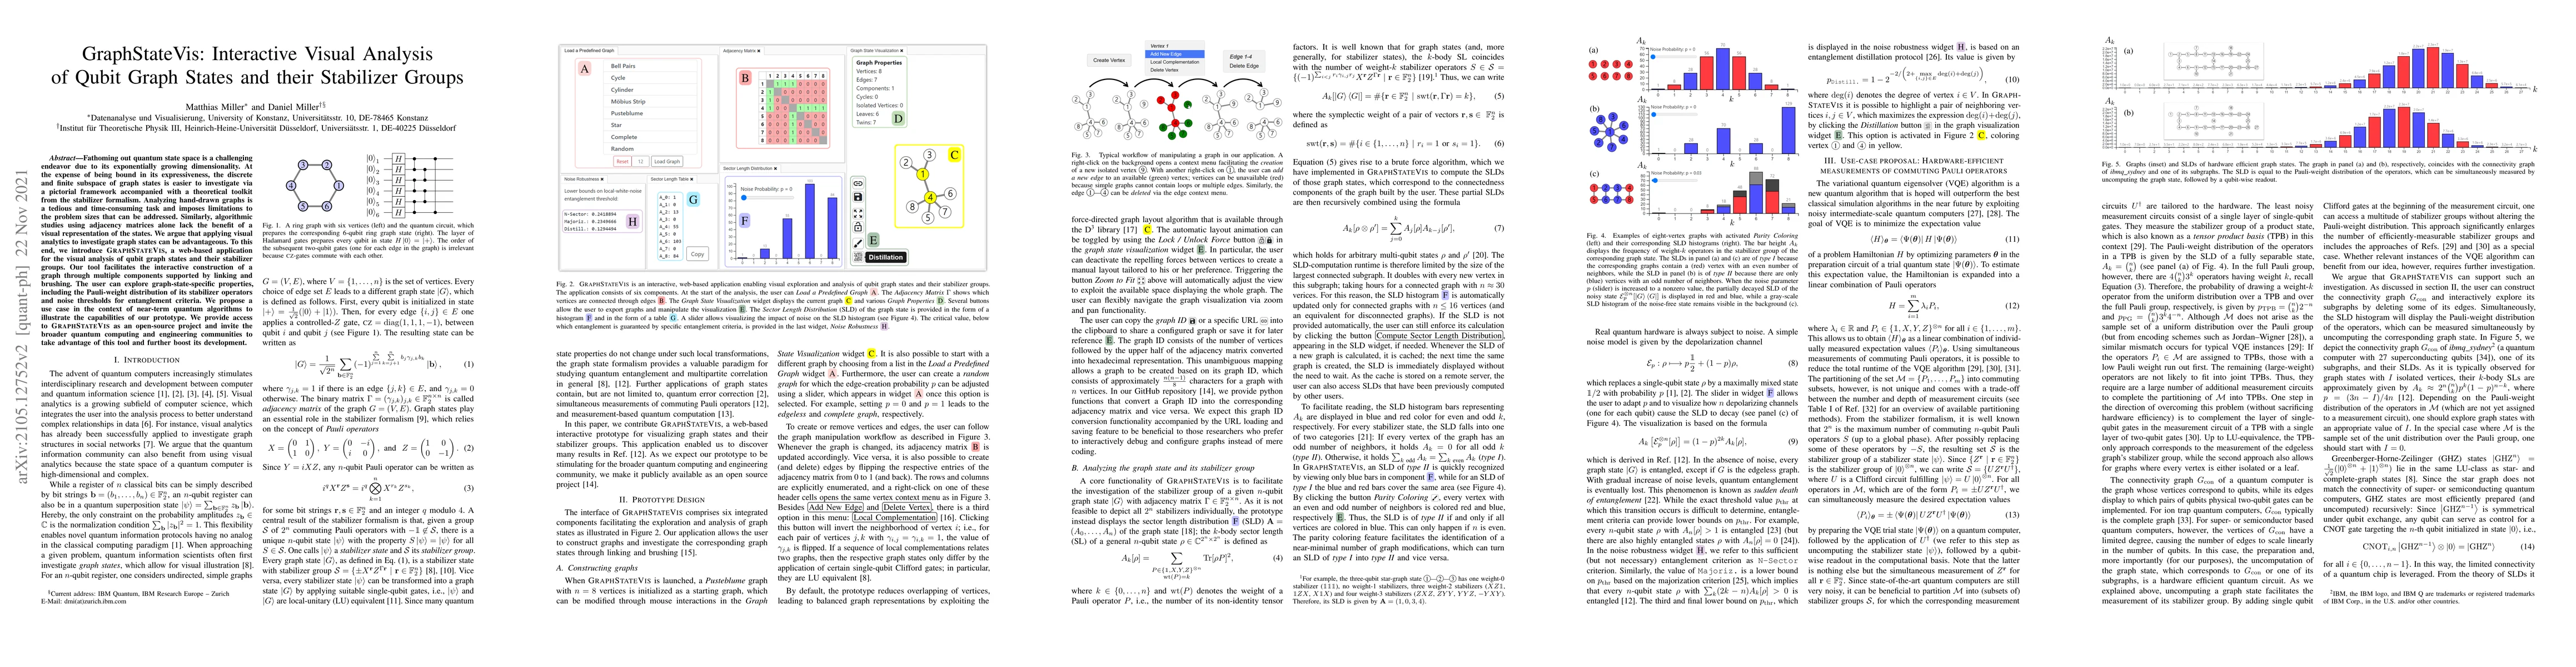
Fathoming out quantum state space is a challenging endeavor due to its exponentially growing dimensionality. At the expense of being bound in its expressiveness, the discrete and finite subspace of graph states is easier to investigate via a pictorial framework accompanied with a theoretical toolkit from the stabilizer formalism. Analyzing hand-drawn graphs is a tedious and time-consuming task and imposes limitations to the problem sizes that can be addressed. Similarly, algorithmic studies using adjacency matrices alone lack the benefit of a visual representation of the states. We argue that applying visual analytics to investigate graph states can be advantageous. To this end, we introduce GraphStateVis, a web-based application for the visual analysis of qubit graph states and their stabilizer groups. Our tool facilitates the interactive construction of a graph through multiple components supported by linking and brushing. The user can explore graph-state-specific properties, including the Pauli-weight distribution of its stabilizer operators and noise thresholds for entanglement criteria. We propose a use case in the context of near-term quantum algorithms to illustrate the capabilities of our prototype. We provide access to GraphStateVis as an open-source project and invite the broader quantum computing and engineering communities to take advantage of this tool and further boost its development.
AI Key Findings
Get AI-generated insights about this paper's methodology, results, significance, and more — seven facets brought into focus.
Impact
Paper Details
Authors
PDF Preview
Key Terms
Citation Network
Current paper (gray), citations (green), references (blue)
Display is limited for performance on very large graphs.
Discussion 0