GraphTSNE: A Visualization Technique for Graph-Structured Data
Publication
Metrics
AI Quick Summary
GraphTSNE is a novel visualization technique that integrates both graph structure and node features for graph-structured data using a modified t-SNE loss and graph convolutional networks. It outperforms traditional t-SNE and other graph-specific techniques by providing scalable, unsupervised insights into complex datasets.
Paper Preview
Abstract
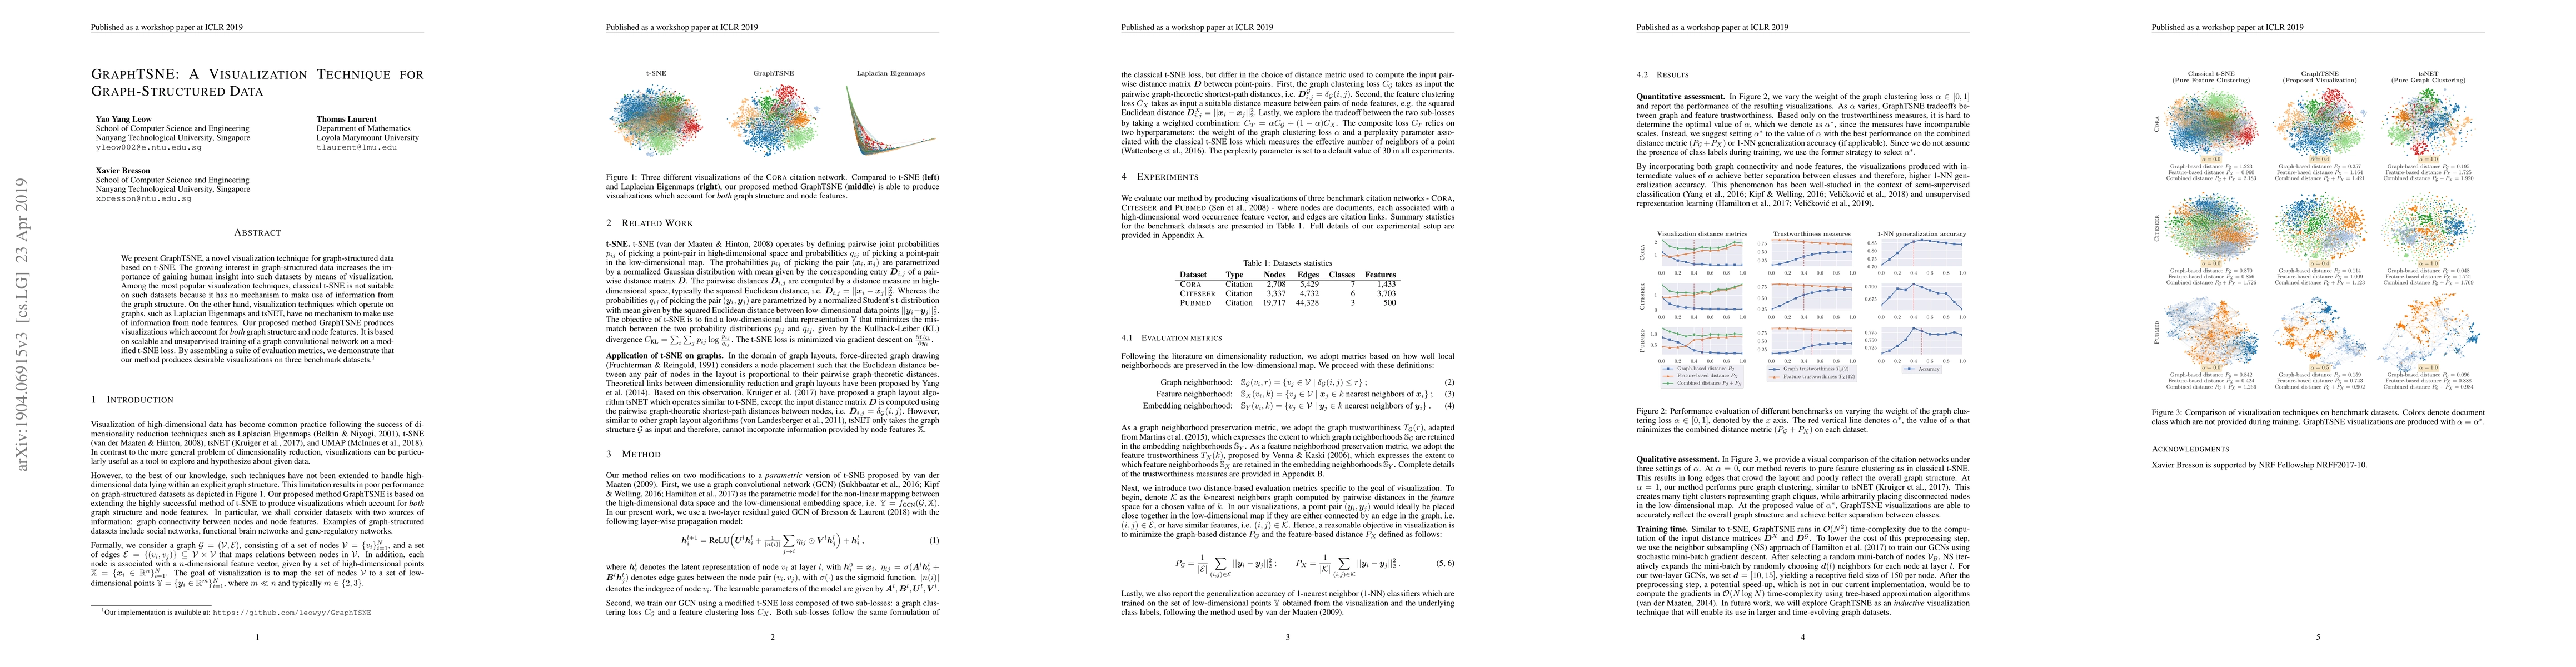
We present GraphTSNE, a novel visualization technique for graph-structured data based on t-SNE. The growing interest in graph-structured data increases the importance of gaining human insight into such datasets by means of visualization. Among the most popular visualization techniques, classical t-SNE is not suitable on such datasets because it has no mechanism to make use of information from the graph structure. On the other hand, visualization techniques which operate on graphs, such as Laplacian Eigenmaps and tsNET, have no mechanism to make use of information from node features. Our proposed method GraphTSNE produces visualizations which account for both graph structure and node features. It is based on scalable and unsupervised training of a graph convolutional network on a modified t-SNE loss. By assembling a suite of evaluation metrics, we demonstrate that our method produces desirable visualizations on three benchmark datasets.
AI Key Findings
Get AI-generated insights about this paper's methodology, results, significance, and more — seven facets brought into focus.
Impact
Paper Details
PDF Preview
Key Terms
Citation Network
Current paper (gray), citations (green), references (blue)
Display is limited for performance on very large graphs.
Discussion 0