Gravitational-wave sensitivity curves
Publication
Metrics
AI Quick Summary
This paper clarifies common conventions for describing gravitational-wave source amplitudes and detector sensitivities, often misunderstood in the community. It presents a comparative analysis of different parameterization methods and provides online tools for generating consistent plots of various detectors' sensitivities.
Paper Preview
Abstract
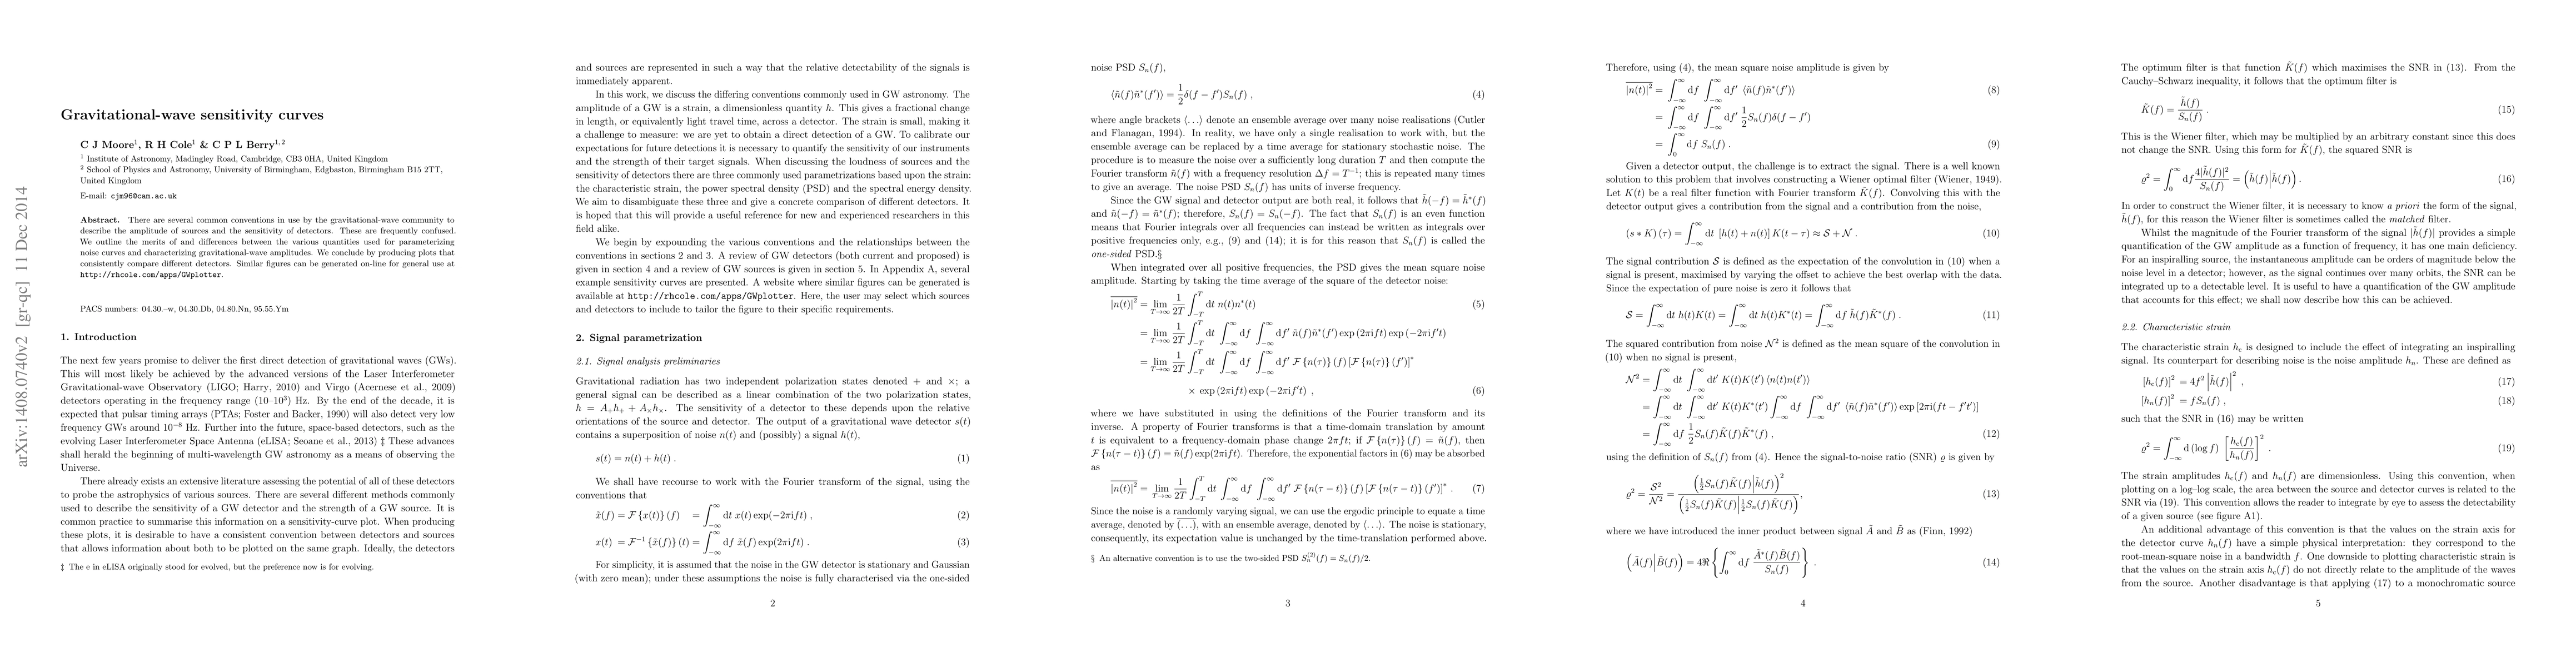
There are several common conventions in use by the gravitational-wave community to describe the amplitude of sources and the sensitivity of detectors. These are frequently confused. We outline the merits of and differences between the various quantities used for parameterizing noise curves and characterizing gravitational-wave amplitudes. We conclude by producing plots that consistently compare different detectors. Similar figures can be generated on-line for general use at \url{http://rhcole.com/apps/GWplotter}.
AI Key Findings
Get AI-generated insights about this paper's methodology, results, significance, and more — seven facets brought into focus.
Impact
Paper Details
PDF Preview
Key Terms
Citation Network
Current paper (gray), citations (green), references (blue)
Display is limited for performance on very large graphs.
Discussion 0