Grey Level Co-occurrence Matrix (GLCM) Based Second Order Statistics for Image Texture Analysis
Publication
Metrics
AI Quick Summary
This study analyzes image texture using Grey Level Co-occurrence Matrix (GLCM) and computes second order statistics for 24 test images in three orientations. Results reveal significant correlations between various texture measures, indicating that smoother images exhibit lower contrast and higher probabilities of occurrence compared to rougher images.
Paper Preview
Abstract
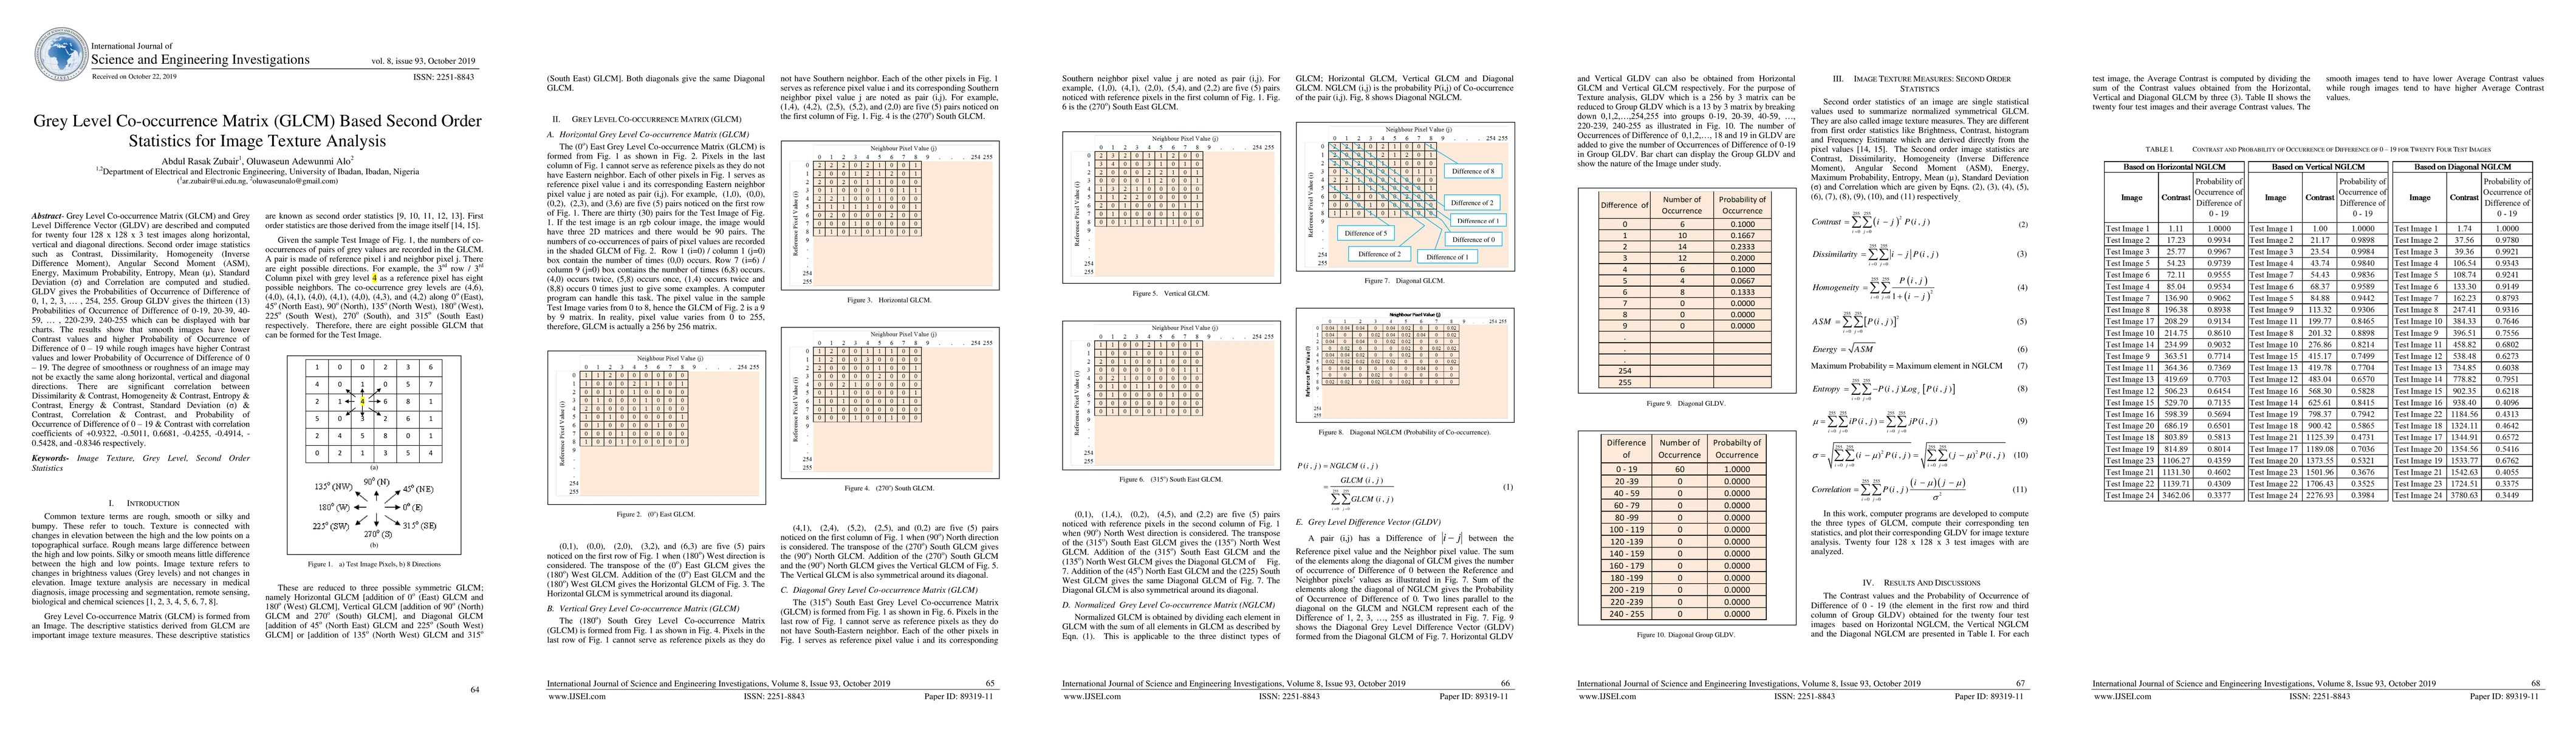
Grey Level Co-occurrence Matrix and Grey Level Difference Vector are described and computed for twenty four 128 x 128 x 3 test images along horizontal, vertical and diagonal directions. Second order image statistics such as Contrast, Dissimilarity, Homogeneity (Inverse Difference Moment), Angular Second Moment, Energy, Maximum Probability, Entropy, Mean, Standard Deviation and Correlation are computed and studied. Grey Level Co-occurrence Matrix (GLCM) and Grey Level Difference Vector (GLDV) are described and computed for twenty four 128 x 128 x 3 test images along horizontal, vertical and diagonal directions. Second order image statistics such as Contrast, Dissimilarity, Homogeneity (Inverse Difference Moment), Angular Second Moment (ASM), Energy, Maximum Probability, Entropy, Mean, Standard Deviation and Correlation are computed and studied. The results show that smooth images have lower Contrast values and higher Probability of Occurrence of Difference of same range as rough images having higher Contrast values and lower Probability of Occurrence. The degree of smoothness or roughness of an image may not be exactly the same along horizontal, vertical and diagonal directions. There are significant correlation between Dissimilarity & Contrast, Homogeneity & Contrast, Entropy & Contrast, Energy & Contrast, Standard Deviation & Contrast, Correlation & Contrast, and Probability of Occurrence of Difference of 0-19 & Contrast with correlation coefficients of 0.9322, -0.5011, 0.6681, -0.4255, -0.4914, 0.5428, and -0.8346 respectively.
AI Key Findings
Get AI-generated insights about this paper's methodology, results, significance, and more — seven facets brought into focus.
Impact
Paper Details
Authors
PDF Preview
Key Terms
Citation Network
Current paper (gray), citations (green), references (blue)
Display is limited for performance on very large graphs.
Discussion 0