Guiding Network Analysis using Graph Slepians: An Illustration for the C. Elegans Connectome
Publication
Metrics
AI Quick Summary
Researchers developed a new approach to guide network analysis using graph Slepian functions, which provide insights into subgraph organization while balancing with global network structure, as illustrated in the C. Elegans connectome.
Paper Preview
Abstract
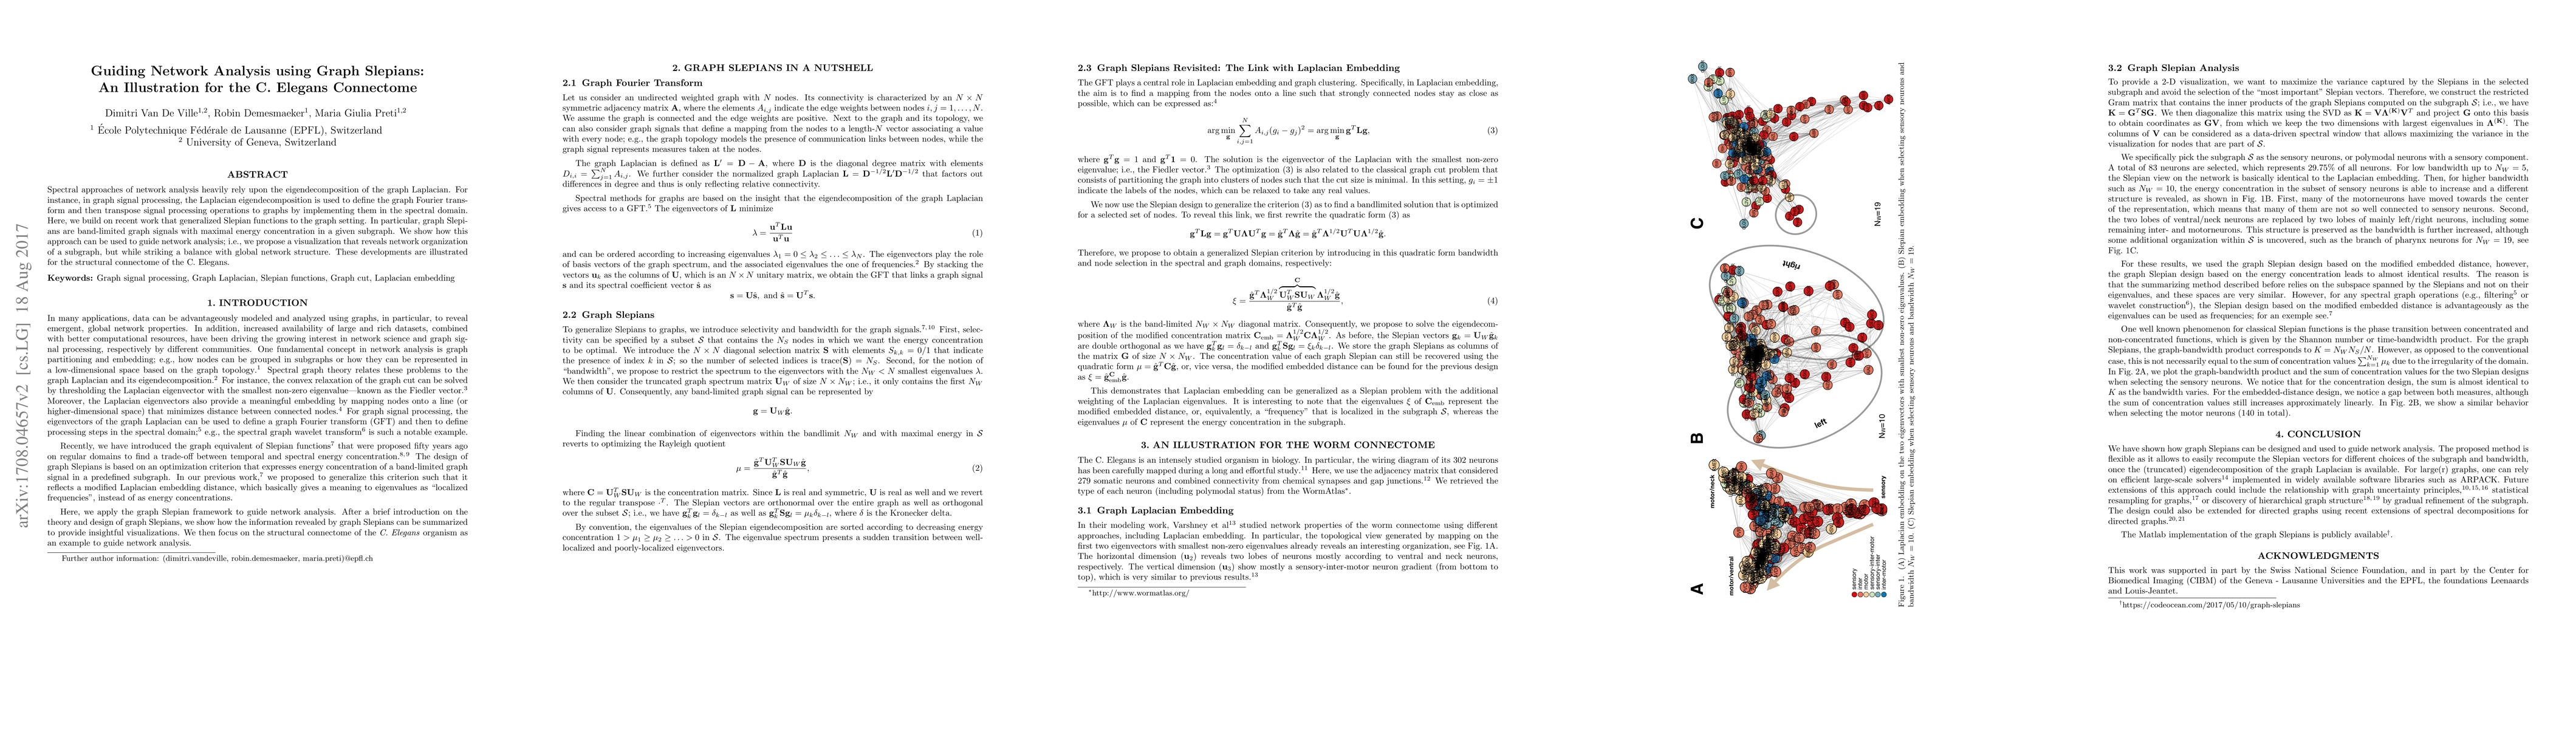
Spectral approaches of network analysis heavily rely upon the eigendecomposition of the graph Laplacian. For instance, in graph signal processing, the Laplacian eigendecomposition is used to define the graph Fourier transform and then transpose signal processing operations to graphs by implementing them in the spectral domain. Here, we build on recent work that generalized Slepian functions to the graph setting. In particular, graph Slepians are band-limited graph signals with maximal energy concentration in a given subgraph. We show how this approach can be used to guide network analysis; i.e., we propose a visualization that reveals network organization of a subgraph, but while striking a balance with global network structure. These developments are illustrated for the structural connectome of the C. Elegans.
AI Key Findings
Get AI-generated insights about this paper's methodology, results, significance, and more — seven facets brought into focus.
Impact
Paper Details
PDF Preview
Key Terms
Citation Network
Current paper (gray), citations (green), references (blue)
Display is limited for performance on very large graphs.
Discussion 0