Summary
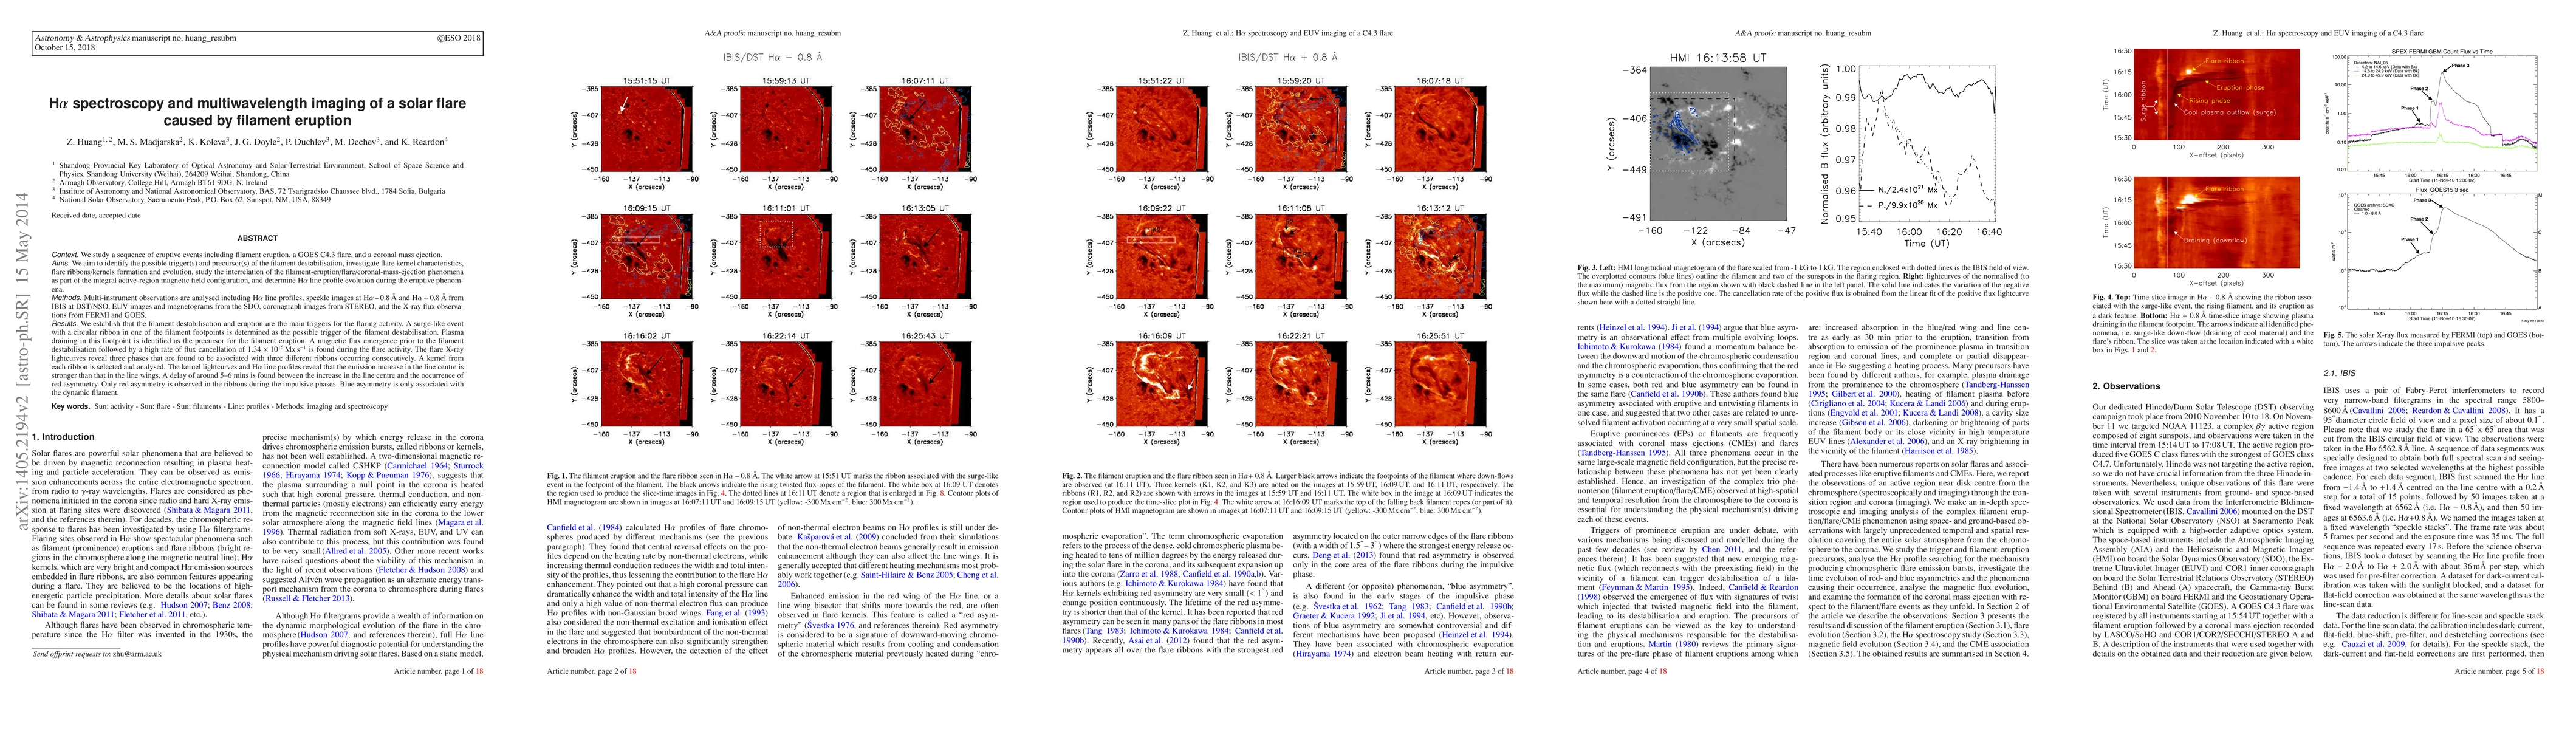
We study a sequence of eruptive events including filament eruption, a GOES C4.3 flare and a coronal mass ejection. We aim to identify the possible trigger(s) and precursor(s) of the filament destabilisation; investigate flare kernel characteristics; flare ribbons/kernels formation and evolution; study the interrelation of the filament-eruption/flare/coronal-mass-ejection phenomena as part of the integral active-region magnetic field configuration; determine H\alpha\ line profile evolution during the eruptive phenomena. Multi-instrument observations are analysed including H\alpha\ line profiles, speckle images at H\alpha-0.8 \AA\ and H\alpha+0.8 \AA\ from IBIS at DST/NSO, EUV images and magnetograms from the SDO, coronagraph images from STEREO and the X-ray flux observations from FERMI and GOES. We establish that the filament destabilisation and eruption are the main trigger for the flaring activity. A surge-like event with a circular ribbon in one of the filament footpoints is determined as the possible trigger of the filament destabilisation. Plasma draining in this footpoint is identified as the precursor for the filament eruption. A magnetic flux emergence prior to the filament destabilisation followed by a high rate of flux cancelation of 1.34$\times10^{16}$ Mx s$^{-1}$ is found during the flare activity. The flare X-ray lightcurves reveal three phases that are found to be associated with three different ribbons occurring consecutively. A kernel from each ribbon is selected and analysed. The kernel lightcurves and H alpha line profiles reveal that the emission increase in the line centre is stronger than that in the line wings. A delay of around 5-6 mins is found between the increase in the line centre and the occurrence of red asymmetry. Only red asymmetry is observed in the ribbons during the impulsive phases. Blue asymmetry is only associated with the dynamic filament.
AI Key Findings
Get AI-generated insights about this paper's methodology, results, and significance.
Paper Details
PDF Preview
Key Terms
Citation Network
Current paper (gray), citations (green), references (blue)
Display is limited for performance on very large graphs.
Similar Papers
Found 4 papersA fast-filament eruption observed in the H$\alpha$ spectral line. I. Imaging spectroscopy diagnostic
Denis P. Cabezas, Kiyoshi Ichimoto, Ayumi Asai et al.
| Title | Authors | Year | Actions |
|---|
Comments (0)