Happy and Immersive Clustering Segmentations of Biological Co-Expression Patterns
Publication
Metrics
AI Quick Summary
This paper introduces a method using hierarchical clustering to create robust biological maps from coexpression data, employing metrics of "happiness" and "immersiveness" to evaluate segmentation strategies. The study finds that high immersiveness correlates with specific, compositionally inferred labels, highlighting the complex relationships in gene expression data.
Paper Preview
Abstract
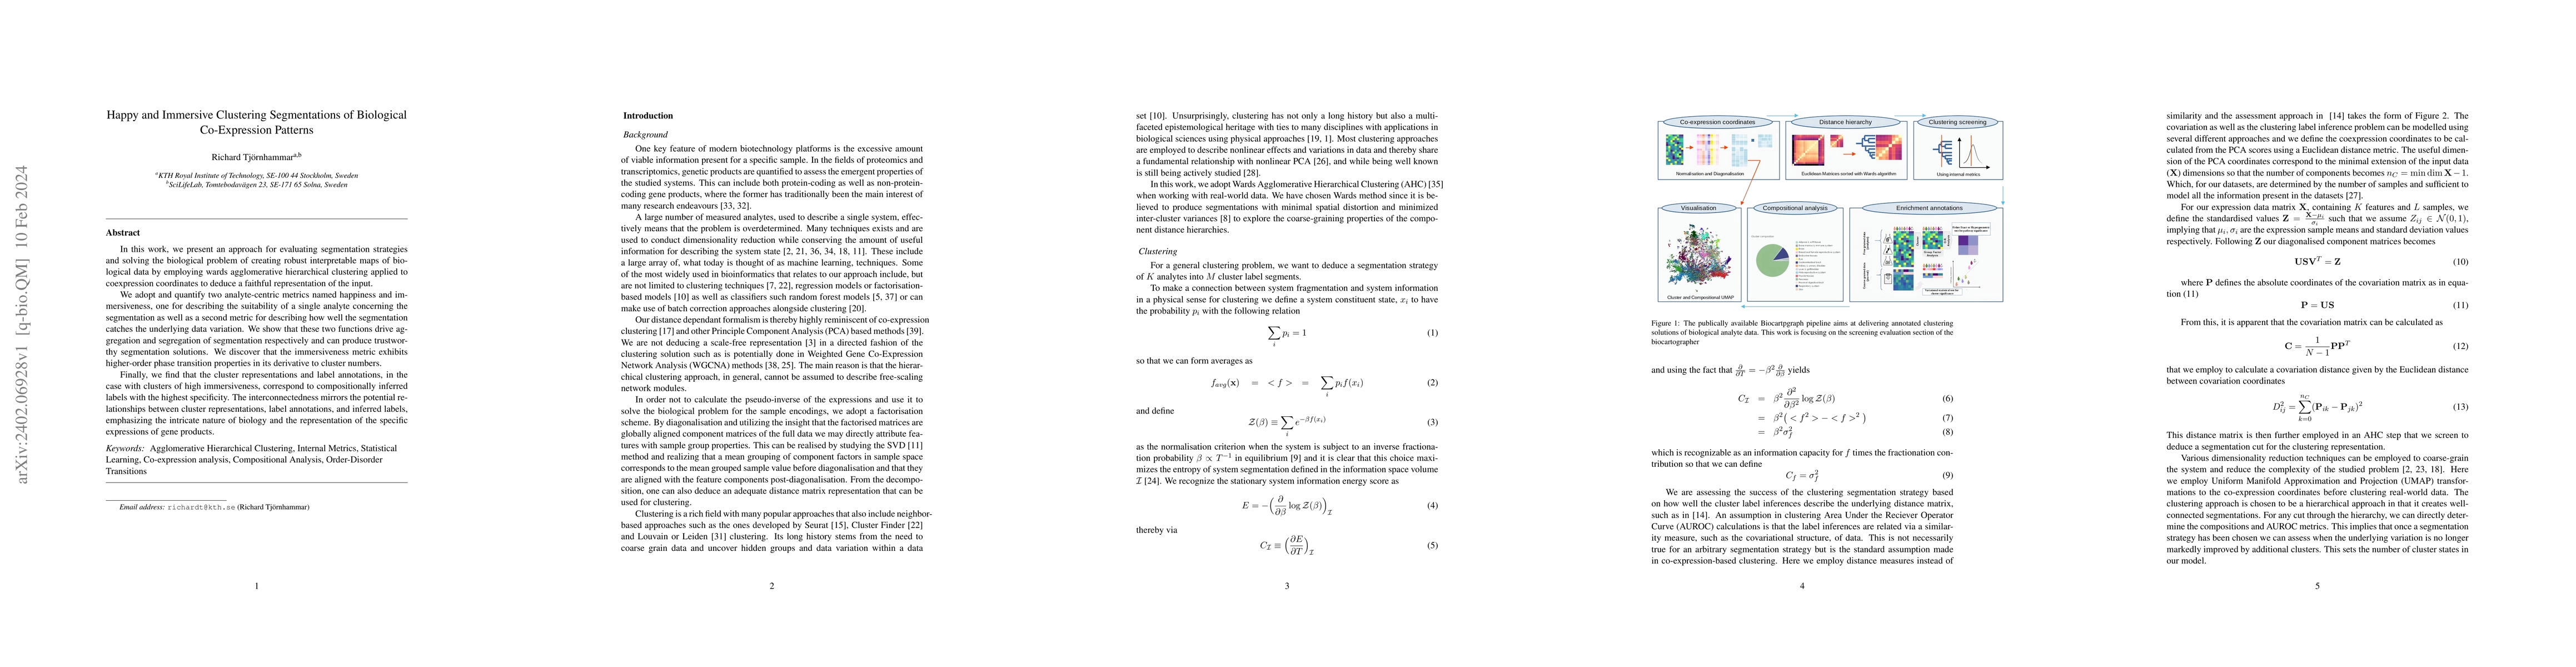
In this work, we present an approach for evaluating segmentation strategies and solving the biological problem of creating robust interpretable maps of biological data by employing wards agglomerative hierarchical clustering applied to coexpression coordinates to deduce a faithful representation of the input. We adopt and quantify two analyte-centric metrics named happiness and immersiveness, one for describing the suitability of a single analyte concerning the segmentation as well as a second metric for describing how well the segmentation catches the underlying data variation. We show that these two functions drive aggregation and segregation of segmentation respectively and can produce trustworthy segmentation solutions. We discover that the immersiveness metric exhibits higher-order phase transition properties in its derivative to cluster numbers. Finally, we find that the cluster representations and label annotations, in the case with clusters of high immersiveness, correspond to compositionally inferred labels with the highest specificity. The interconnectedness mirrors the potential relationships between cluster representations, label annotations, and inferred labels, emphasizing the intricate nature of biology and the representation of the specific expressions of gene products.
AI Key Findings
Get AI-generated insights about this paper's methodology, results, significance, and more — seven facets brought into focus.
Impact
Paper Details
Authors
PDF Preview
Key Terms
Citation Network
Current paper (gray), citations (green), references (blue)
Display is limited for performance on very large graphs.
Discussion 0