Publication
Metrics
AI Quick Summary
This study uses simulations to show that magnetically-dominated turbulence in pair plasmas generates anisotropic particle distributions, leading to a much harder synchrotron spectral slope ($s\sim 0.5-0.7$) than expected from isotropic particles. The anisotropy counteracts the effect of a steeper particle spectrum, potentially explaining the hard synchrotron spectra observed in astrophysical sources like Pulsar Wind Nebulae.
Paper Preview
Abstract
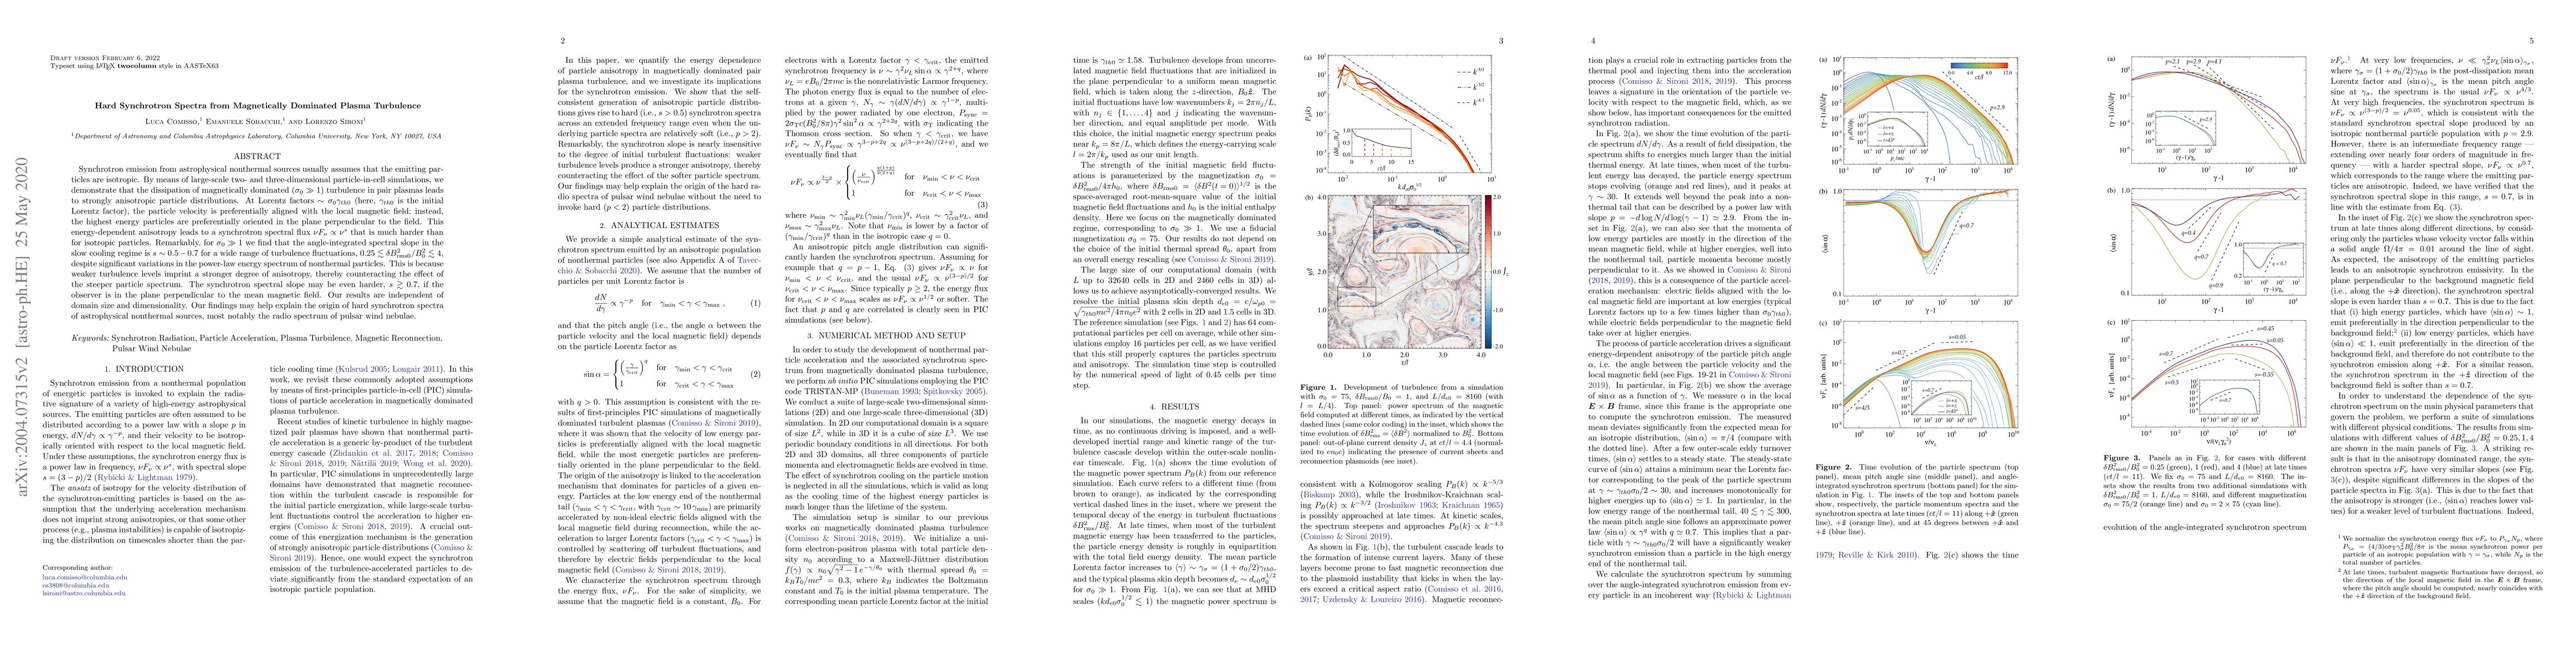
Synchrotron emission from astrophysical nonthermal sources usually assumes that the emitting particles are isotropic. By means of large-scale two- and three-dimensional particle-in-cell simulations, we demonstrate that the dissipation of magnetically-dominated ($\sigma_0\gg1$) turbulence in pair plasmas leads to strongly anisotropic particle distributions. At Lorentz factors $\sim \sigma_0 \gamma_{th0}$ (here, $\gamma_{th0}$ is the initial Lorentz factor), the particle velocity is preferentially aligned with the local magnetic field; instead, the highest energy particles are roughly isotropic. This energy-dependent anisotropy leads to a synchrotron spectral flux $\nu F_\nu\propto \nu^s$ that is much harder than for isotropic particles. Remarkably, for $\sigma_0\gg1$ we find that the solid-angle-averaged spectral slope in the slow cooling regime is $s\sim 0.5-0.7$ for a wide range of turbulence fluctuations, $0.25\lesssim \delta B_{\rm rms0}^2/B_0^2\lesssim 4$, despite significant variations in the power-law energy spectrum of nonthermal particles. This is because weaker turbulence levels imprint a stronger degree of anisotropy, thereby counteracting the effect of the steeper particle spectrum. The synchrotron spectral slope may be even harder, $s\gtrsim 0.7$, if the observer is in the plane perpendicular to the mean magnetic field. Our results are independent of domain size and dimensionality. Our findings may help explaining the origin of hard synchrotron spectra of astrophysical nonthermal sources, most notably the radio spectrum of Pulsar Wind Nebulae.
AI Key Findings
Get AI-generated insights about this paper's methodology, results, significance, and more — seven facets brought into focus.
Impact
Paper Details
Authors
PDF Preview
Key Terms
Citation Network
Current paper (gray), citations (green), references (blue)
Display is limited for performance on very large graphs.
Discussion 0