Hardware Versus Software Fault Injection of Modern Undervolted SRAMs
Publication
Metrics
AI Quick Summary
This paper investigates the accuracy of random fault injection in simulating undervolted SRAMs compared to hardware-guided fault injection. The study extends the Gem5 simulator to support cache fault injection and compares the resiliency of benchmarks using fault maps derived from real undervolted SRAMs versus randomly corrupted bits, revealing differences in resiliency up to 24%.
Paper Preview
Abstract
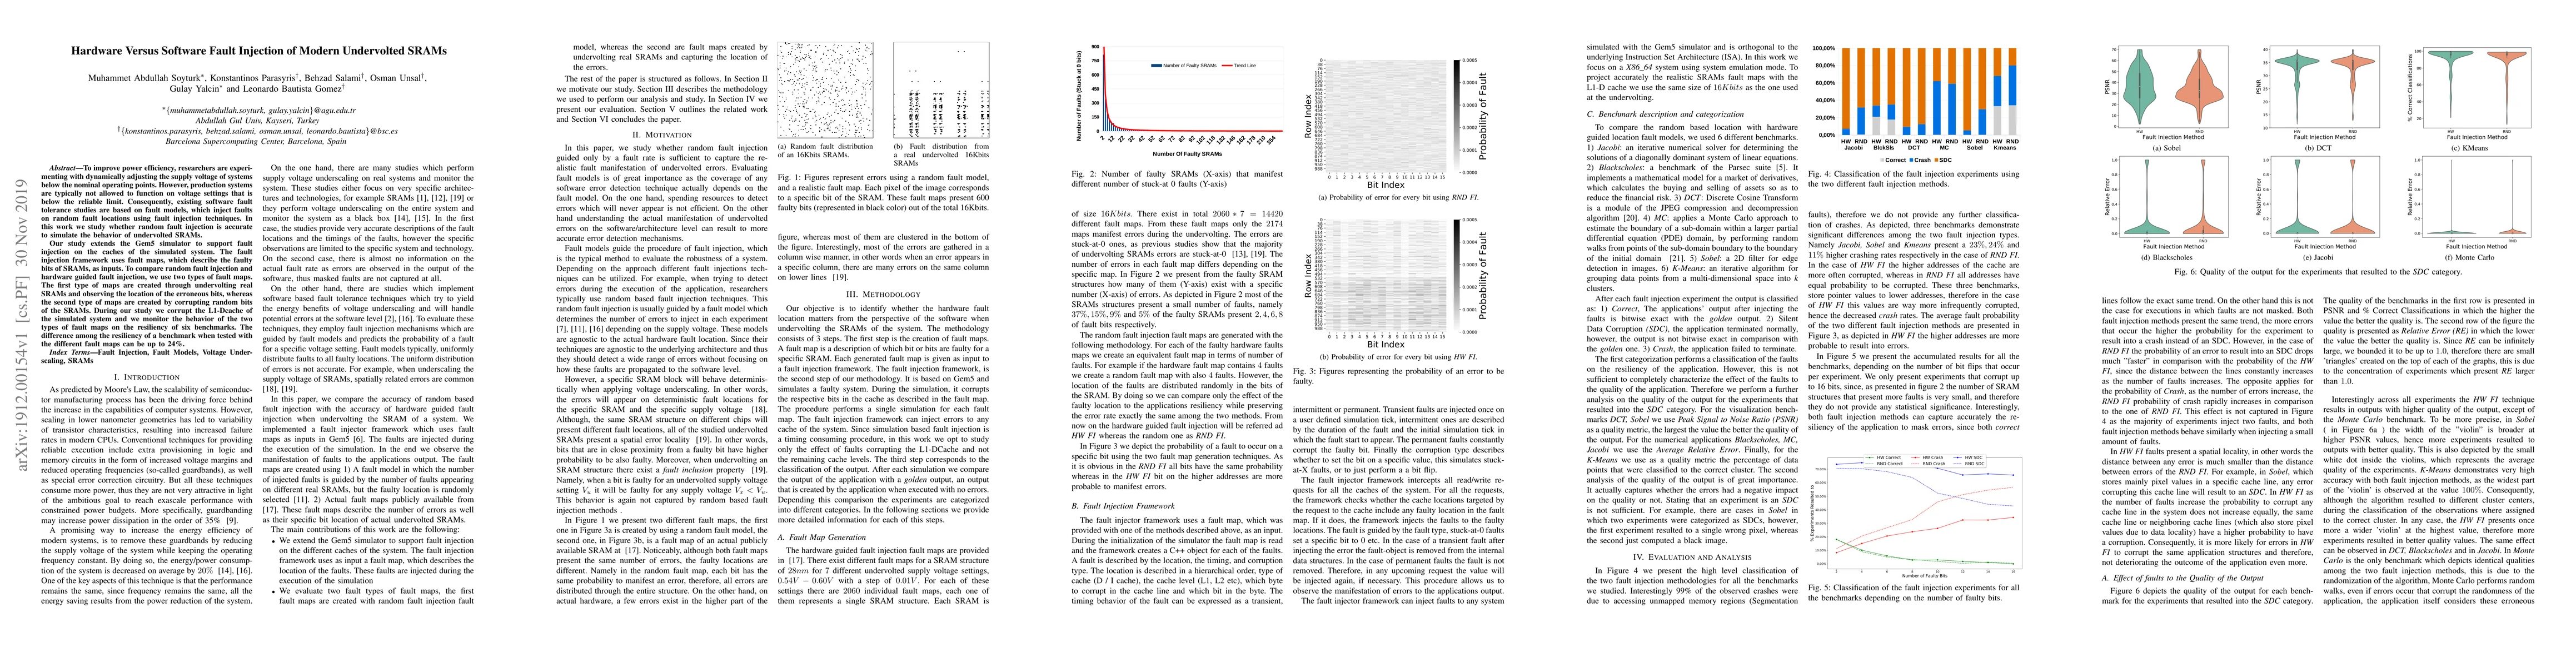
To improve power efficiency, researchers are experimenting with dynamically adjusting the supply voltage of systems below the nominal operating points. However, production systems are typically not allowed to function on voltage settings that is below the reliable limit. Consequently, existing software fault tolerance studies are based on fault models, which inject faults on random fault locations using fault injection techniques. In this work we study whether random fault injection is accurate to simulate the behavior of undervolted SRAMs. Our study extends the Gem5 simulator to support fault injection on the caches of the simulated system. The fault injection framework uses fault maps, which describe the faulty bits of SRAMs, as inputs. To compare random fault injection and hardware guided fault injection, we use two types of fault maps. The first type of maps are created through undervolting real SRAMs and observing the location of the erroneous bits, whereas the second type of maps are created by corrupting random bits of the SRAMs. During our study we corrupt the L1-Dcache of the simulated system and we monitor the behavior of the two types of fault maps on the resiliency of six benchmarks. The difference among the resiliency of a benchmark when tested with the different fault maps can be up to 24%.
AI Key Findings
Get AI-generated insights about this paper's methodology, results, significance, and more — seven facets brought into focus.
Impact
Paper Details
Authors
PDF Preview
Key Terms
Citation Network
Current paper (gray), citations (green), references (blue)
Display is limited for performance on very large graphs.
Discussion 0