Summary
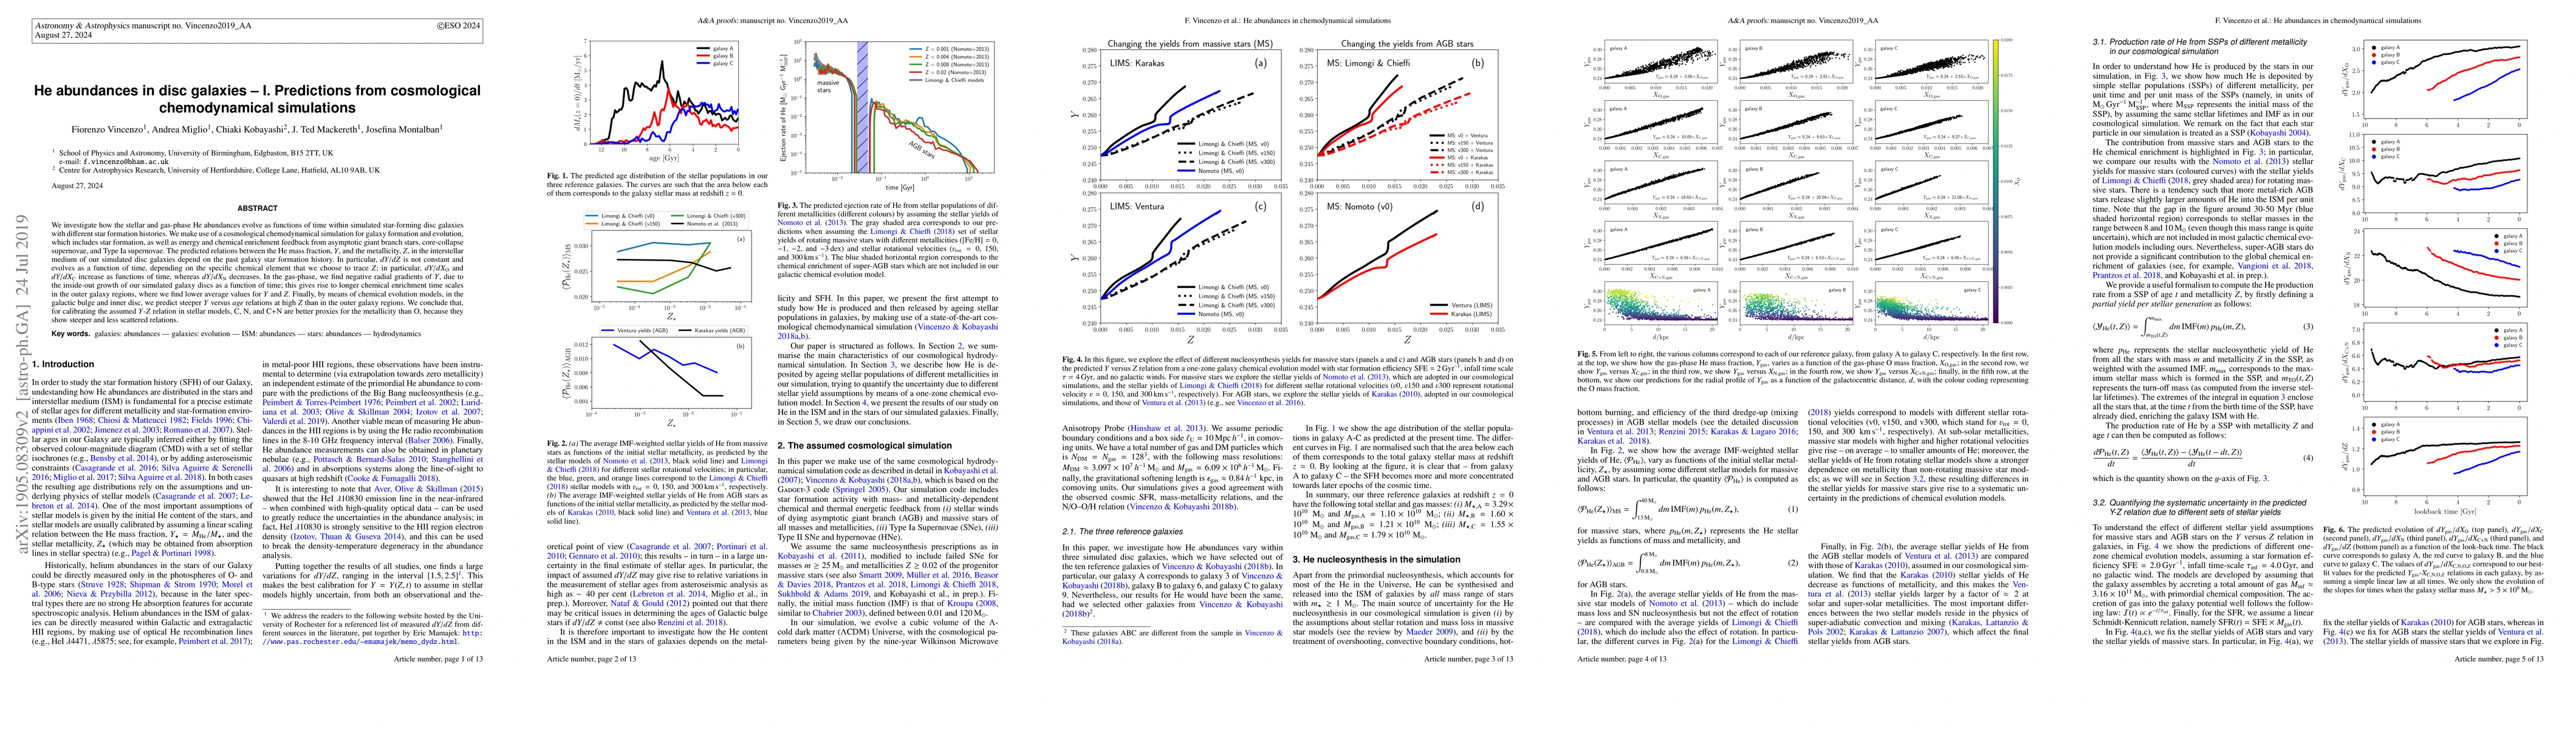
We investigate how the stellar and gas-phase He abundances evolve as functions of time within simulated star-forming disc galaxies with different star formation histories. We make use of a cosmological chemodynamical simulation for galaxy formation and evolution, which includes star formation, as well as energy and chemical enrichment feedback from asymptotic giant branch stars, core-collapse supernovae, and Type Ia supernovae. The predicted relations between the He mass fraction, $Y$, and the metallicity, $Z$, in the interstellar medium of our simulated disc galaxies depend on the past galaxy star formation history. In particular, $dY/dZ$ is not constant and evolves as a function of time, depending on the specific chemical element that we choose to trace $Z$; in particular, $dY/dX_{\text{O}}$ and $dY/dX_{\text{C}}$ increase as functions of time, whereas $dY/dX_{\text{N}}$ decreases. In the gas-phase, we find negative radial gradients of $Y$, due to the inside-out growth of our simulated galaxy discs as a function of time; this gives rise to longer chemical enrichment time scales in the outer galaxy regions, where we find lower average values for $Y$ and $Z$. Finally, by means of chemical evolution models, in the galactic bulge and inner disc, we predict steeper $Y$ versus age relations at high $Z$ than in the outer galaxy regions. We conclude that, for calibrating the assumed $Y$-$Z$ relation in stellar models, C, N, and C+N are better proxies for the metallicity than O, because they show steeper and less scattered relations.
AI Key Findings
Get AI-generated insights about this paper's methodology, results, and significance.
Paper Details
PDF Preview
Key Terms
Citation Network
Current paper (gray), citations (green), references (blue)
Display is limited for performance on very large graphs.
Similar Papers
Found 4 papers| Title | Authors | Year | Actions |
|---|
Comments (0)