ArxivLens

Quick Summary:

This paper reports the detection of hydrogen fluoride (HF) in absorption towards Orion KL using Herschel/HIFI, revealing a P-Cygni profile indicative of outflow dynamics. The derived HF abundance relative to hydrogen nuclei is approximately 1.6 x 10^-10, aligning with previous findings but contrasting with lower limits found in cold foreground clouds.

DOI: 10.1051/0004-6361/201014570
arXiv Id: 1007.2149
Comments: 5 pages, 3 figures, paper to be published in the Herschel special issue of A&A letters
Date Published: 2015-05-19
Date Updated: 2015-05-19

Categories:

Key Terms (TF-IDF):

absorption (0.261)
column density (0.255)
outflow (0.236)
abundance (0.209)
column (0.208)
hydrogen (0.204)
molecular (0.173)
estimate (0.161)
velocity (0.158)
sgr (0.157)
removal (0.150)
lower (0.144)
blue (0.143)
limit (0.143)
associated (0.141)
line sight (0.137)
sight (0.136)
inferred (0.131)
rotational (0.129)
density (0.129)
License: http://arxiv.org/licenses/nonexclusive-distrib/1.0/

Summary:

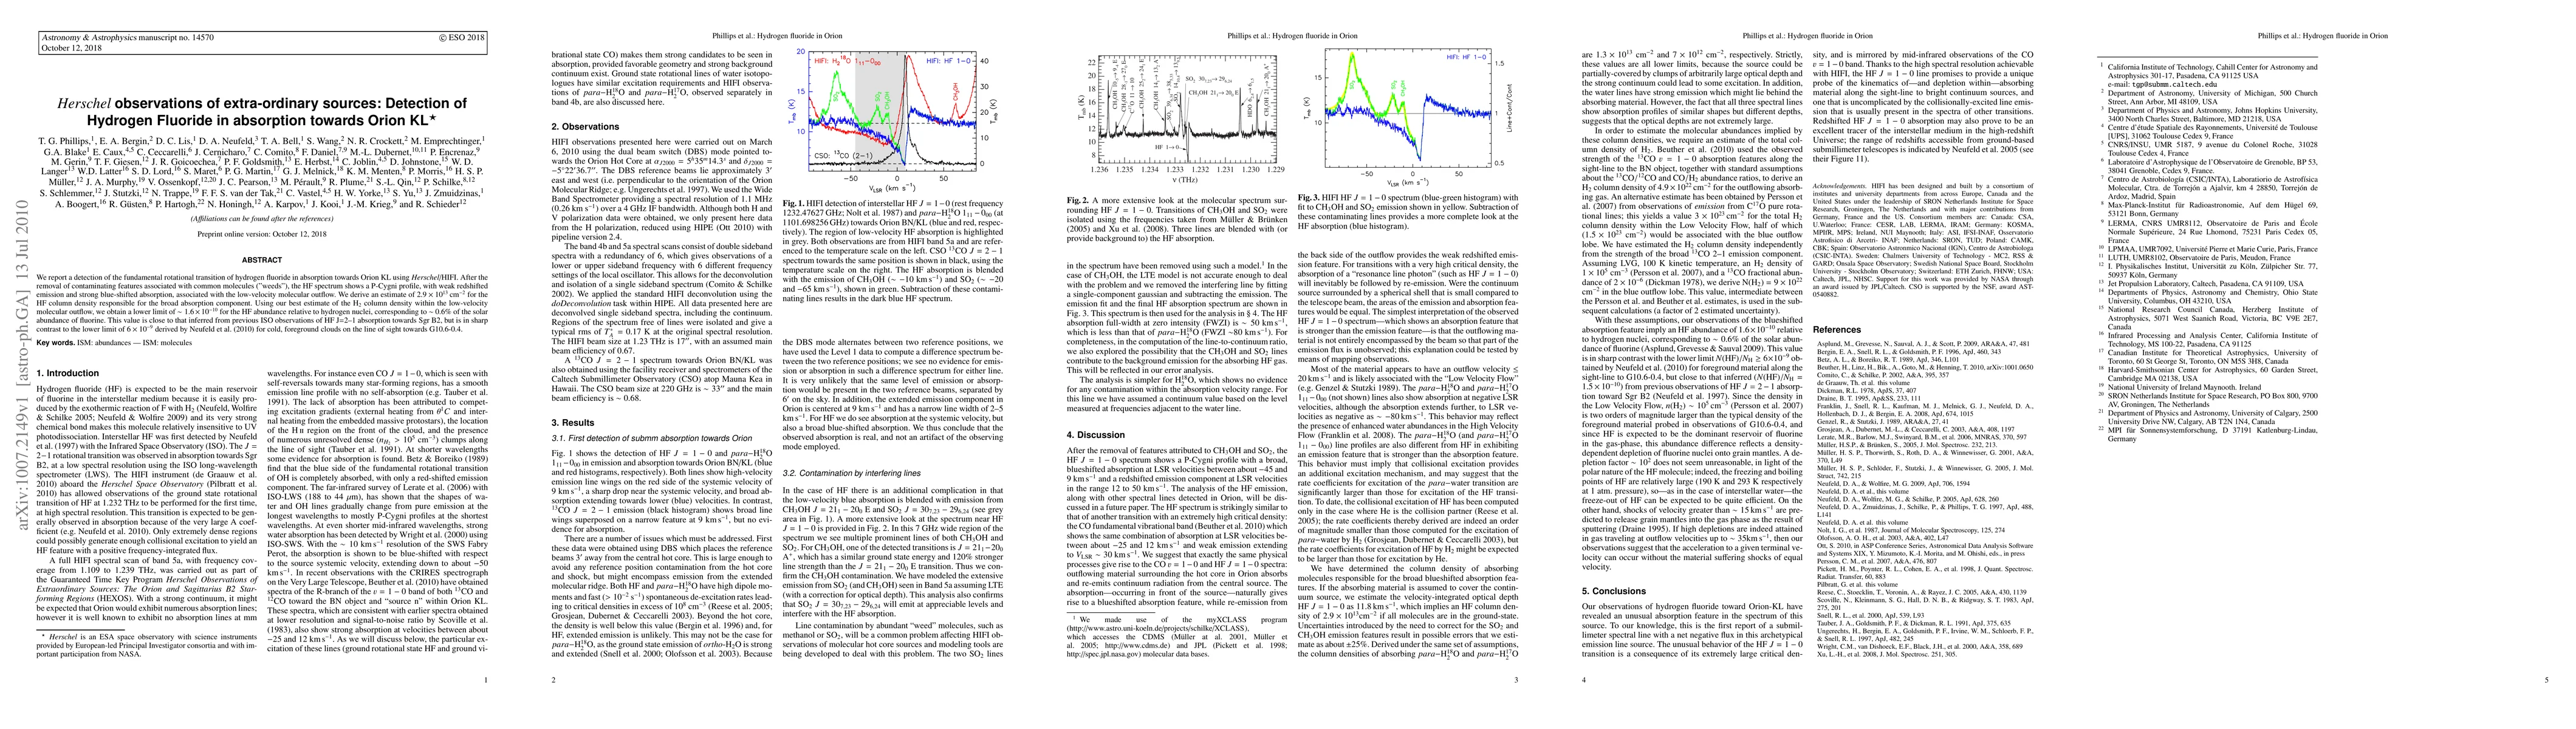
We report a detection of the fundamental rotational transition of hydrogen fluoride in absorption towards Orion KL using Herschel/HIFI. After the removal of contaminating features associated with common molecules ("weeds"), the HF spectrum shows a P-Cygni profile, with weak redshifted emission and strong blue-shifted absorption, associated with the low-velocity molecular outflow. We derive an estimate of 2.9 x 10^13 cm^-2 for the HF column density responsible for the broad absorption component. Using our best estimate of the H2 column density within the low-velocity molecular outflow, we obtain a lower limit of ~1.6 x 10^-10 for the HF abundance relative to hydrogen nuclei, corresponding to 0.6% of the solar abundance of fluorine. This value is close to that inferred from previous ISO observations of HF J=2--1 absorption towards Sgr B2, but is in sharp contrast to the lower limit of 6 x 10^-9 derived by Neufeld et al. (2010) for cold, foreground clouds on the line of sight towards G10.6-0.4.

Citation & Reference Network Visualization

This graph shows how this paper is connected to other research. The current paper is shown in dark gray, papers that cite it are in green, and papers it references are in blue. You can:

Current Paper
Papers citing this work (Citations)
Papers cited by this work (References)

• Hover over any node to see the paper title

• Click a node to view that paper's details

• Drag nodes to rearrange the graph

• Use the zoom controls (bottom right) to zoom in/out

Comments (0)

This website uses cookies to ensure you get the best experience. Learn more