Hierarchical Graph Pooling is an Effective Citywide Traffic Condition Prediction Model
Publication
Metrics
AI Quick Summary
This paper explores hierarchical graph pooling methods to predict citywide traffic conditions, demonstrating their effectiveness over baselines. It contrasts node clustering and node drop pooling, analyzing their advantages and weaknesses for traffic prediction, and evaluates the impact of different graph network inputs on prediction accuracy.
Paper Preview
Abstract
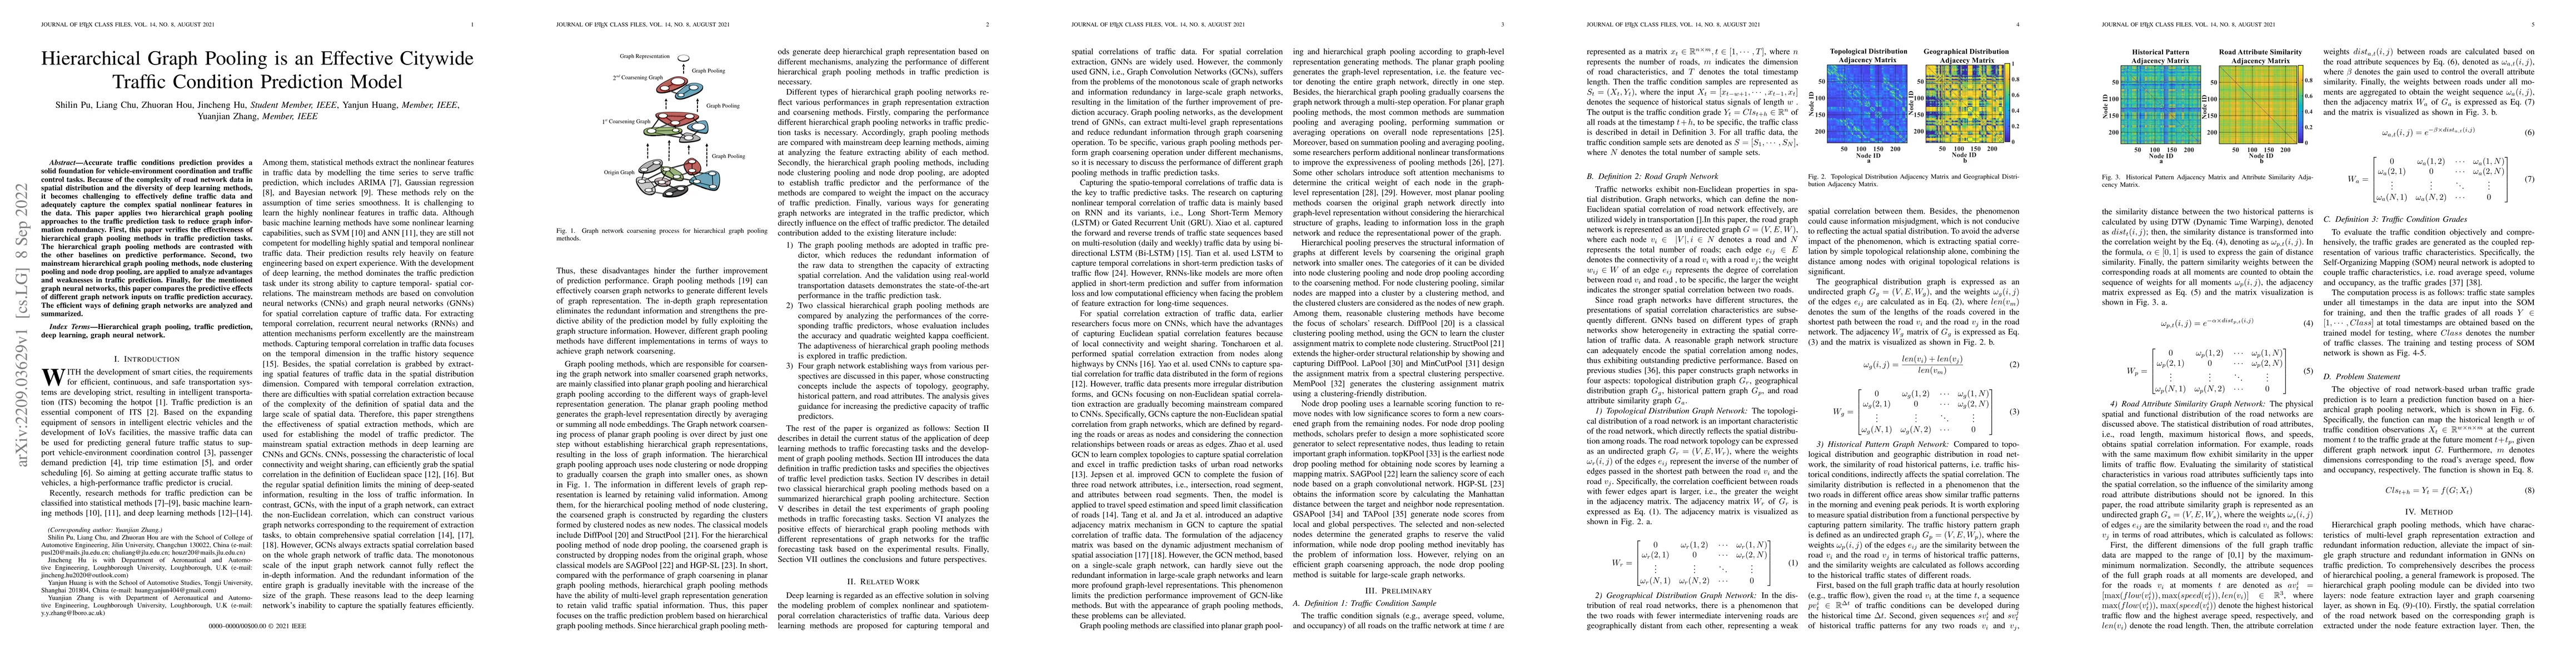
Accurate traffic conditions prediction provides a solid foundation for vehicle-environment coordination and traffic control tasks. Because of the complexity of road network data in spatial distribution and the diversity of deep learning methods, it becomes challenging to effectively define traffic data and adequately capture the complex spatial nonlinear features in the data. This paper applies two hierarchical graph pooling approaches to the traffic prediction task to reduce graph information redundancy. First, this paper verifies the effectiveness of hierarchical graph pooling methods in traffic prediction tasks. The hierarchical graph pooling methods are contrasted with the other baselines on predictive performance. Second, two mainstream hierarchical graph pooling methods, node clustering pooling and node drop pooling, are applied to analyze advantages and weaknesses in traffic prediction. Finally, for the mentioned graph neural networks, this paper compares the predictive effects of different graph network inputs on traffic prediction accuracy. The efficient ways of defining graph networks are analyzed and summarized.
AI Key Findings
Get AI-generated insights about this paper's methodology, results, significance, and more — seven facets brought into focus.
Impact
Paper Details
Authors
PDF Preview
Key Terms
Citation Network
Current paper (gray), citations (green), references (blue)
Display is limited for performance on very large graphs.
Discussion 0