Authors
Summary
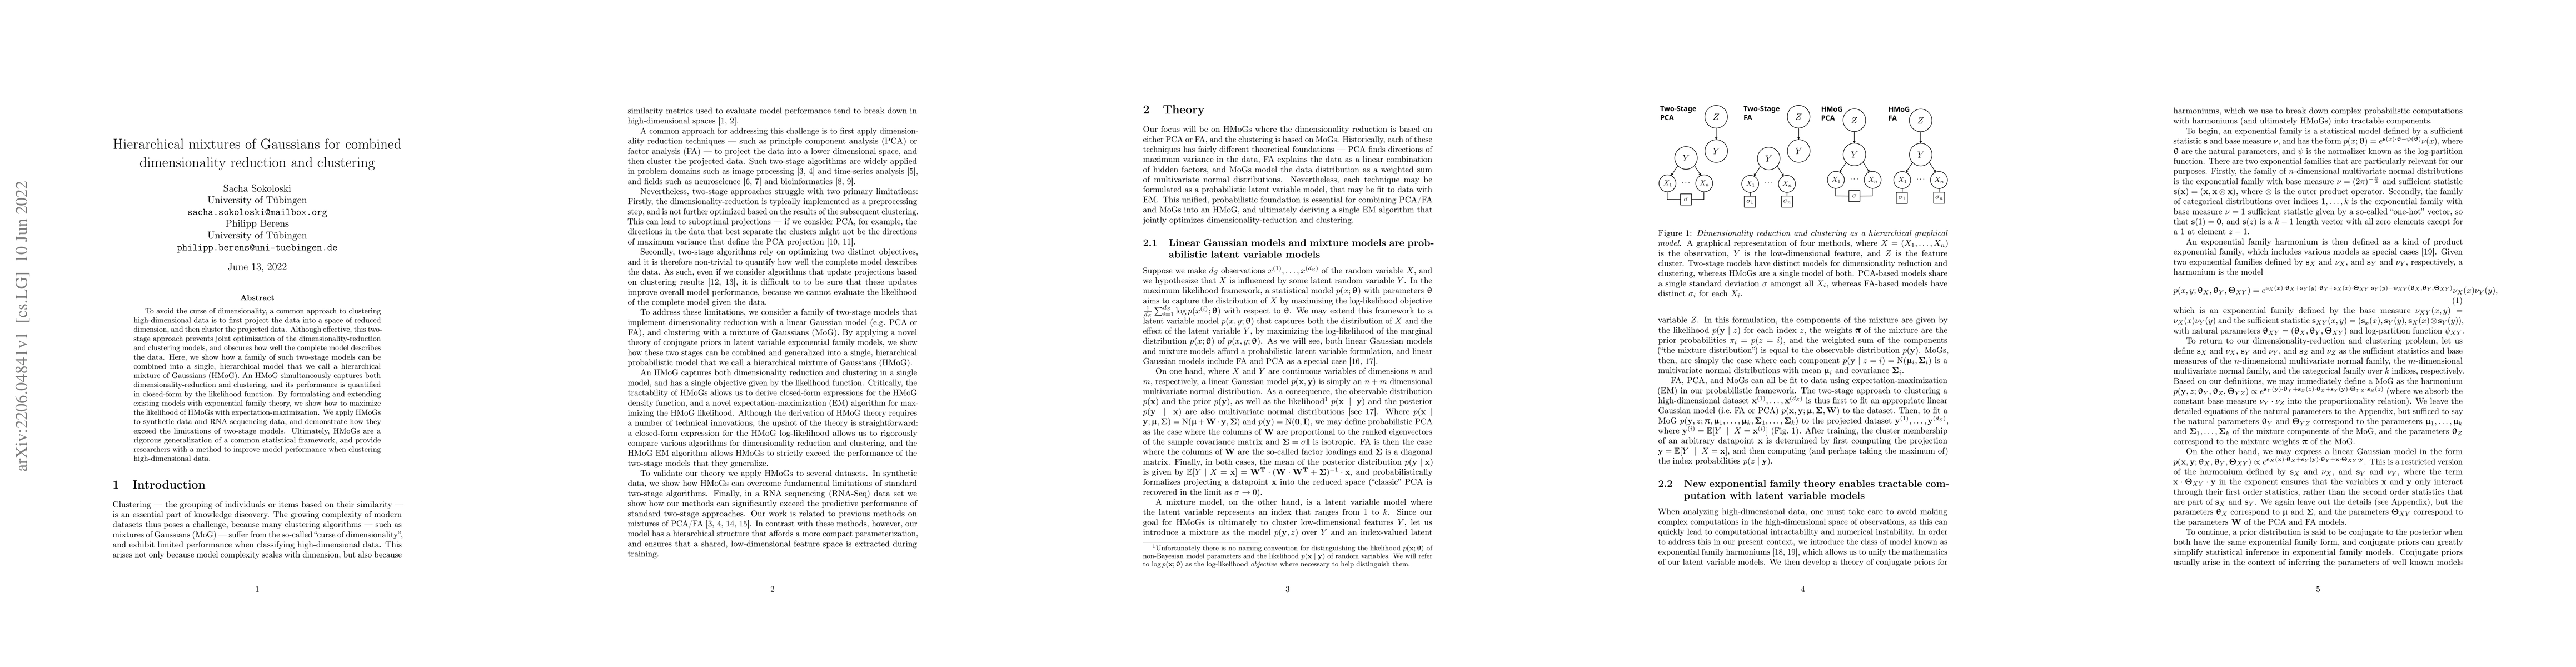
To avoid the curse of dimensionality, a common approach to clustering high-dimensional data is to first project the data into a space of reduced dimension, and then cluster the projected data. Although effective, this two-stage approach prevents joint optimization of the dimensionality-reduction and clustering models, and obscures how well the complete model describes the data. Here, we show how a family of such two-stage models can be combined into a single, hierarchical model that we call a hierarchical mixture of Gaussians (HMoG). An HMoG simultaneously captures both dimensionality-reduction and clustering, and its performance is quantified in closed-form by the likelihood function. By formulating and extending existing models with exponential family theory, we show how to maximize the likelihood of HMoGs with expectation-maximization. We apply HMoGs to synthetic data and RNA sequencing data, and demonstrate how they exceed the limitations of two-stage models. Ultimately, HMoGs are a rigorous generalization of a common statistical framework, and provide researchers with a method to improve model performance when clustering high-dimensional data.
AI Key Findings
Get AI-generated insights about this paper's methodology, results, and significance.
Paper Details
PDF Preview
Key Terms
Citation Network
Current paper (gray), citations (green), references (blue)
Display is limited for performance on very large graphs.
Similar Papers
Found 4 papersNo citations found for this paper.
Comments (0)