Hierarchical Multivariate Directed Acyclic Graph Auto-Regressive (MDAGAR) models for spatial diseases mapping
Publication
Metrics
Paper Preview
Abstract
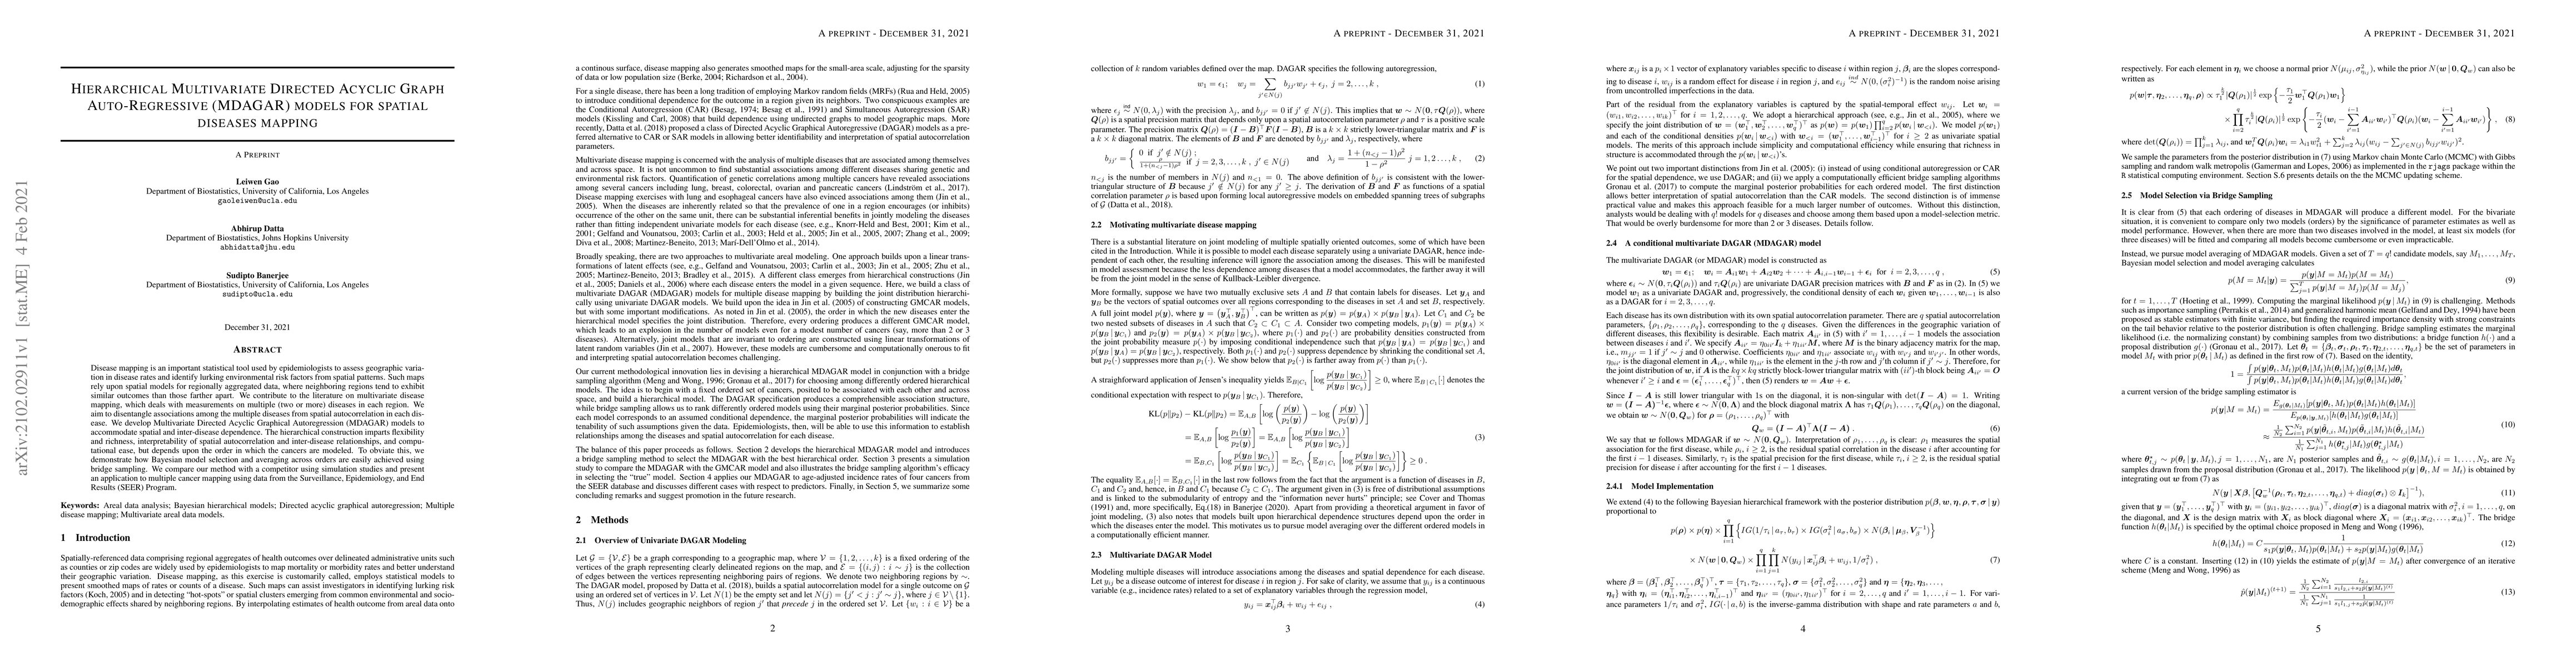
Disease mapping is an important statistical tool used by epidemiologists to assess geographic variation in disease rates and identify lurking environmental risk factors from spatial patterns. Such maps rely upon spatial models for regionally aggregated data, where neighboring regions tend to exhibit similar outcomes than those farther apart. We contribute to the literature on multivariate disease mapping, which deals with measurements on multiple (two or more) diseases in each region. We aim to disentangle associations among the multiple diseases from spatial autocorrelation in each disease. We develop Multivariate Directed Acyclic Graphical Autoregression (MDAGAR) models to accommodate spatial and inter-disease dependence. The hierarchical construction imparts flexibility and richness, interpretability of spatial autocorrelation and inter-disease relationships, and computational ease, but depends upon the order in which the cancers are modeled. To obviate this, we demonstrate how Bayesian model selection and averaging across orders are easily achieved using bridge sampling. We compare our method with a competitor using simulation studies and present an application to multiple cancer mapping using data from the Surveillance, Epidemiology, and End Results (SEER) Program.
AI Key Findings
Get AI-generated insights about this paper's methodology, results, significance, and more — seven facets brought into focus.
Impact
Paper Details
Authors
PDF Preview
Key Terms
Citation Network
Current paper (gray), citations (green), references (blue)
Display is limited for performance on very large graphs.
Discussion 0