High Dimensional Principal Component Scores and Data Visualization
Publication
Metrics
AI Quick Summary
This paper addresses the paradox in high-dimensional principal component analysis where, despite consistent eigenvectors, principal component scores become inconsistent in high-dimensional, low-sample size contexts. The study resolves this by showing that the ratio between sample and population scores converges to a non-degenerate random variable, leading to inconsistent axis labels but consistent relative point positions.
Paper Preview
Abstract
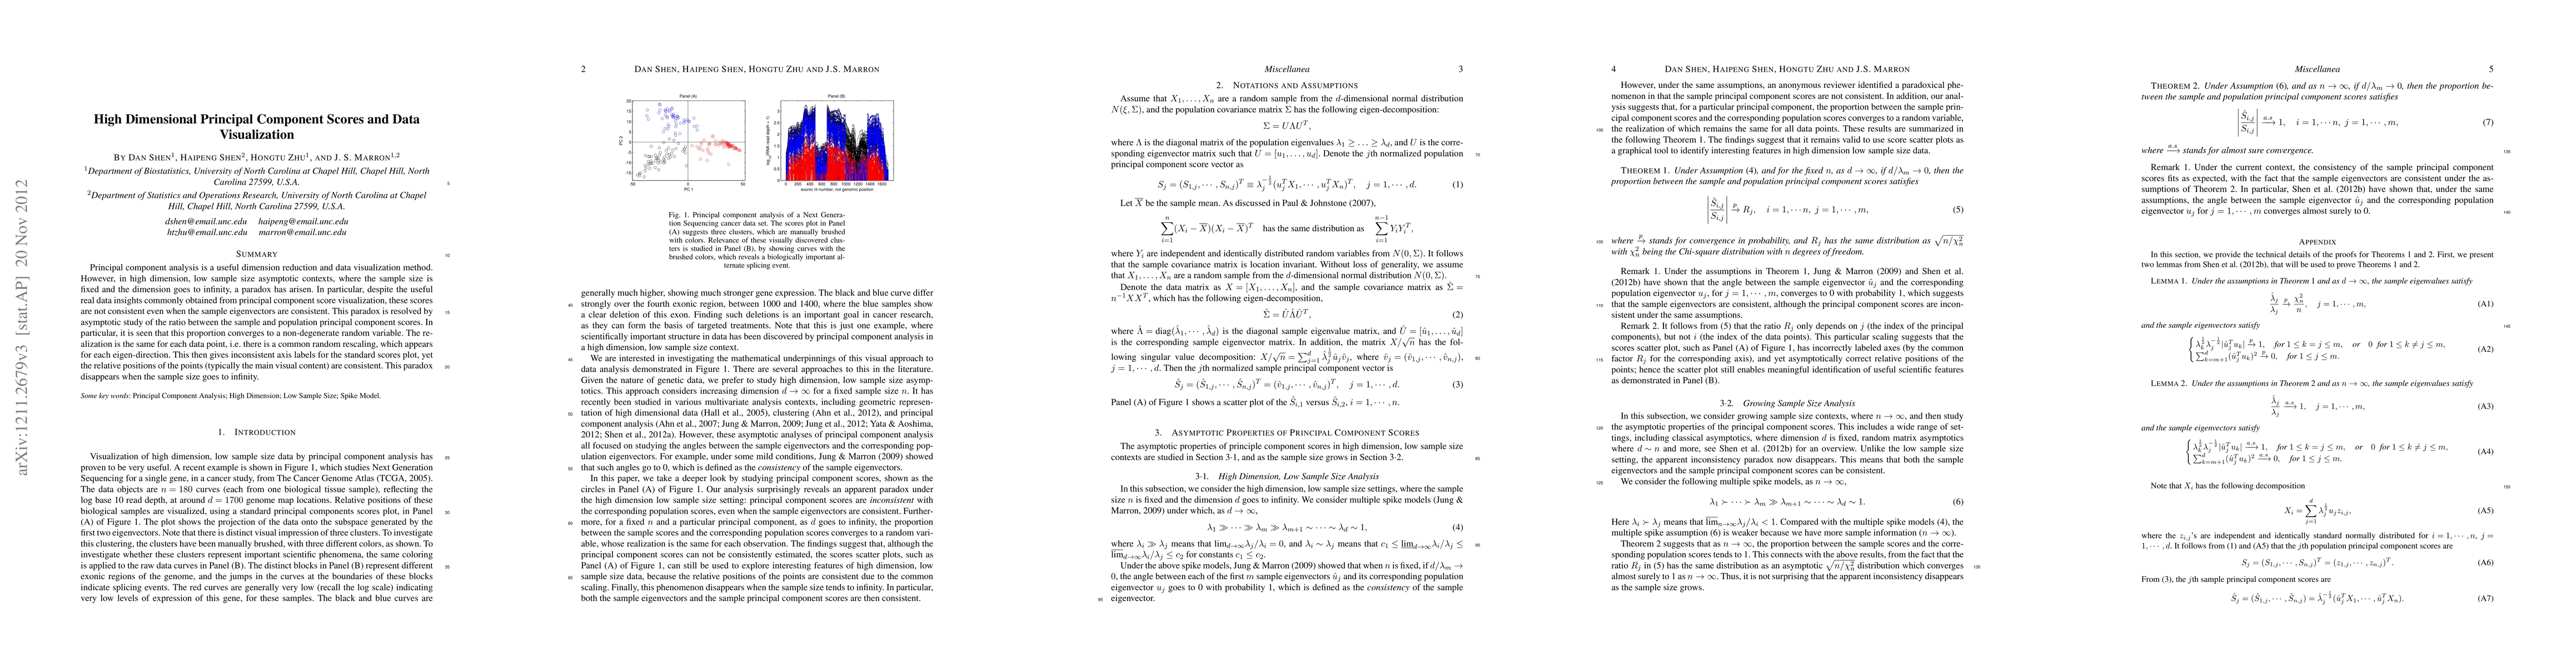
Principal component analysis is a useful dimension reduction and data visualization method. However, in high dimension, low sample size asymptotic contexts, where the sample size is fixed and the dimension goes to infinity,a paradox has arisen. In particular, despite the useful real data insights commonly obtained from principal component score visualization, these scores are not consistent even when the sample eigen-vectors are consistent. This paradox is resolved by asymptotic study of the ratio between the sample and population principal component scores. In particular, it is seen that this proportion converges to a non-degenerate random variable. The realization is the same for each data point, i.e. there is a common random rescaling, which appears for each eigen-direction. This then gives inconsistent axis labels for the standard scores plot, yet the relative positions of the points (typically the main visual content) are consistent. This paradox disappears when the sample size goes to infinity.
AI Key Findings
Get AI-generated insights about this paper's methodology, results, significance, and more — seven facets brought into focus.
Impact
Paper Details
PDF Preview
Key Terms
Citation Network
Current paper (gray), citations (green), references (blue)
Display is limited for performance on very large graphs.
Discussion 0