AI Quick Summary
This paper investigates high-frequency lead/lag relationships in asset markets, finding that more liquid assets often lead less liquid stocks, with significant intraday variations. Predictive models based on leader assets can forecast laggers' midquote changes with 60% accuracy, though market order strategies cannot profit due to bid/ask spreads.
Paper Preview
Abstract
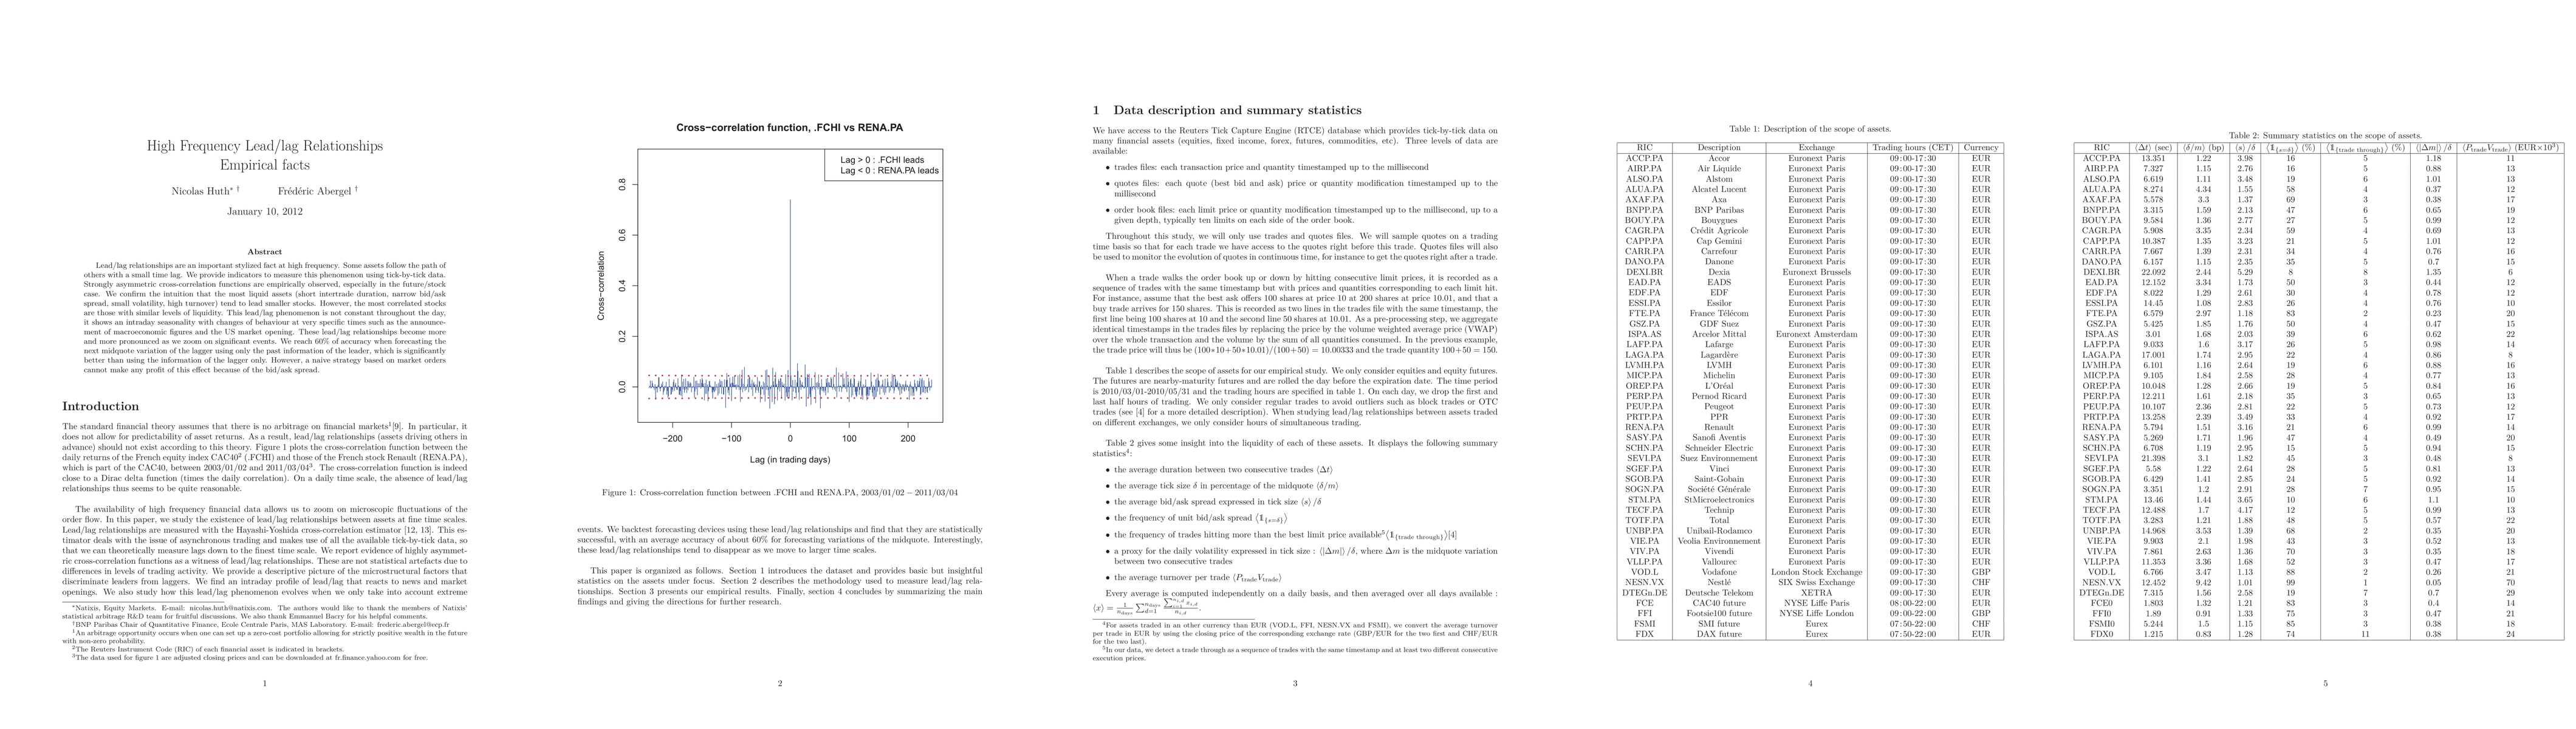
Lead/lag relationships are an important stylized fact at high frequency. Some assets follow the path of others with a small time lag. We provide indicators to measure this phenomenon using tick-by-tick data. Strongly asymmetric cross-correlation functions are empirically observed, especially in the future/stock case. We confirm the intuition that the most liquid assets (short intertrade duration, narrow bid/ask spread, small volatility, high turnover) tend to lead smaller stocks. However, the most correlated stocks are those with similar levels of liquidity. This lead/lag phenomenon is not constant throughout the day, it shows an intraday seasonality with changes of behaviour at very specific times such as the announcement of macroeconomic figures and the US market opening. These lead/lag relationships become more and more pronounced as we zoom on significant events. We reach 60% of accuracy when forecasting the next midquote variation of the lagger using only the past information of the leader, which is significantly better than using the information of the lagger only. However, a naive strategy based on market orders cannot make any profit of this effect because of the bid/ask spread.
AI Key Findings
Get AI-generated insights about this paper's methodology, results, and significance.
Paper Details
How to Cite This Paper
@article{anon2012high,
  title         = {High Frequency Lead/lag Relationships - Empirical facts},
  year          = {2012},
  eprint        = {1111.7103},
  archivePrefix = {arXiv},
  primaryClass  = {q-fin.TR},
}(2012). High Frequency Lead/lag Relationships - Empirical facts. arXiv. https://arxiv.org/abs/1111.7103"High Frequency Lead/lag Relationships - Empirical facts." arXiv, 2012, arxiv.org/abs/1111.7103.PDF Preview
Key Terms
Citation Network
Current paper (gray), citations (green), references (blue)
Display is limited for performance on very large graphs.
Similar Papers
Found 4 papersLead-lag Relationships in Foreign Exchange Markets
Lasko Basnarkov, Ljupco Kocarev, Viktor Stojkoski et al.
| Title | Authors | Year | Actions |
|---|
Comments (0)