Publication
Metrics
AI Quick Summary
This research investigates the magnetic field phase diagram of U$_{1-x}$Th$_x$Te$_2$ at low temperatures, revealing three superconducting phases influenced by field orientation. The low-field phase persists but weakens with increasing Th concentration, while the high-field and field-polarized phases are suppressed as disorder increases.
Paper Preview
Abstract
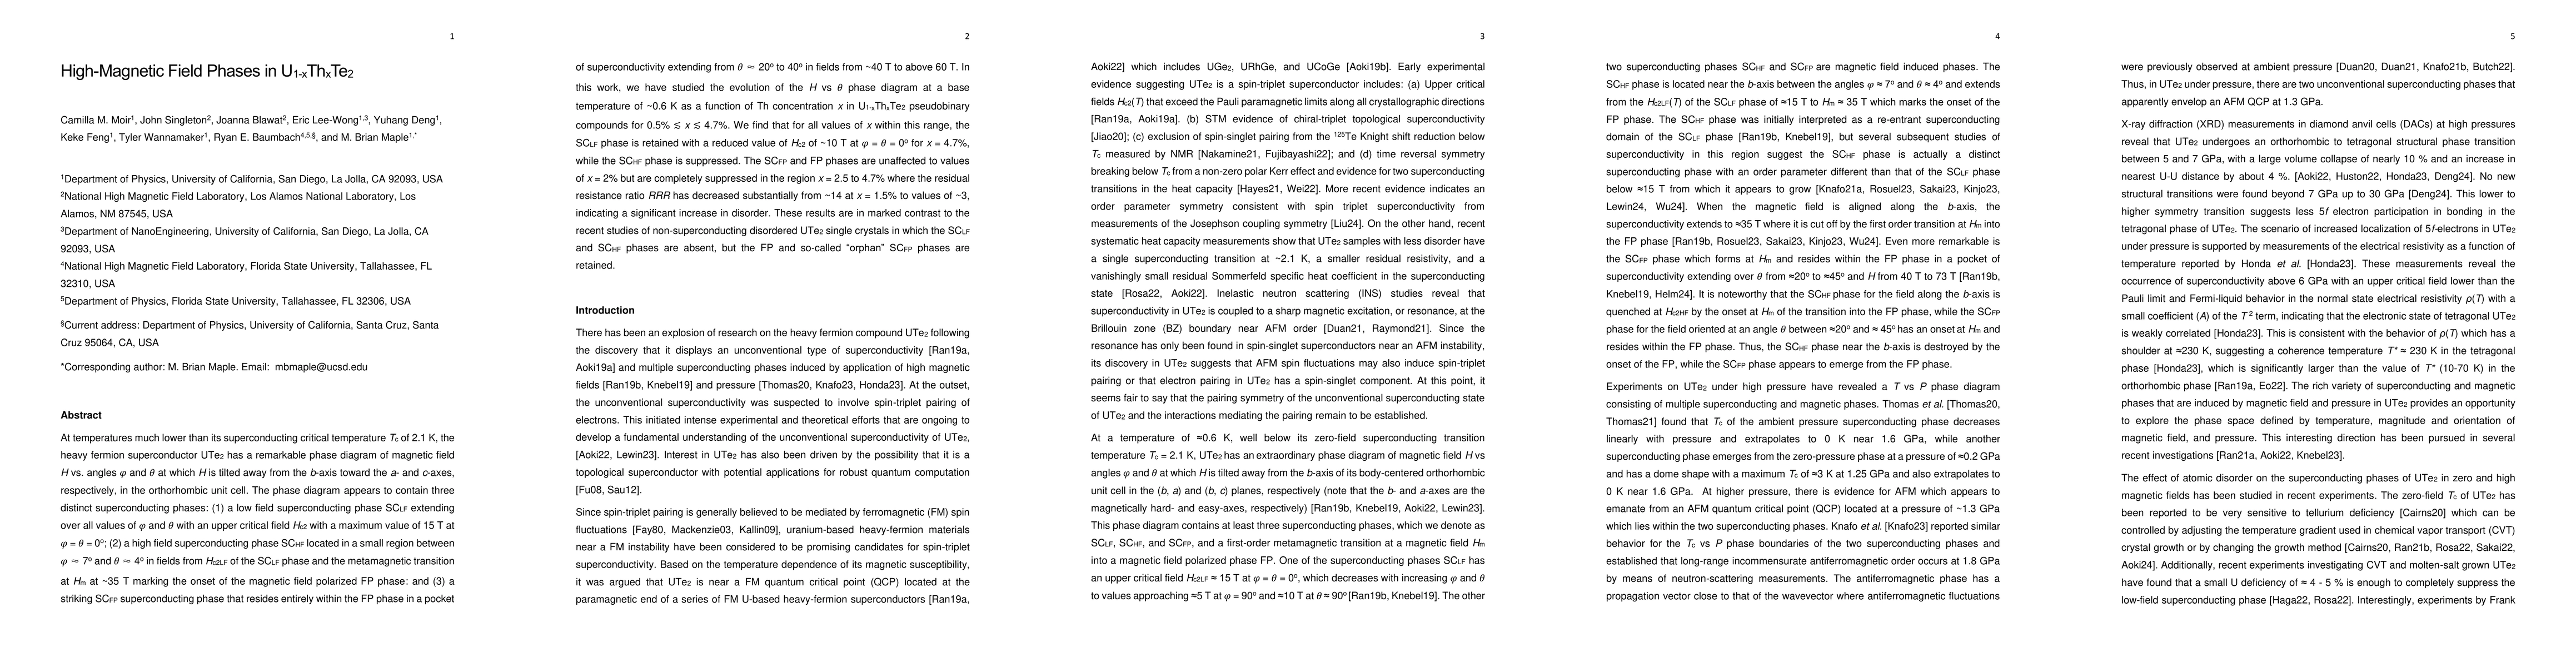
At temperatures much lower than its superconducting critical temperature $T_c$ of 2.1 K, the heavy fermion superconductor UTe$_2$ has a remarkable phase diagram of magnetic field $H$ vs. angles $\phi$ and $\theta$ at which $H$ is tilted away from the $b$-axis toward the $a$- and $c$-axes, respectively, in the orthorhombic unit cell. The phase diagram appears to contain three superconducting phases: (1) a low field superconducting phase SC$_{\mathrm{LF}}$ extending over all values of $\phi$ and $\theta$ with an upper critical field $H_{c2}$ with a maximum value of 15 T at $\phi = \theta = 0^\circ$; (2) a high field superconducting phase SC$_{\mathrm{HF}}$ located in a region between $\phi \approx 7^\circ$ and $\theta \approx 4^\circ$ in fields from $H_{c2\mathrm{LF}}$ of the SC$_{\mathrm{LF}}$ phase and the metamagnetic transition at $H_m$ at $\sim 35$ T marking the onset of the magnetic field polarized FP phase: and (3) a SC$_{\mathrm{FP}}$ superconducting phase that resides entirely within the FP phase in a pocket of superconductivity extending from $\theta \approx 20^\circ$ to $40^\circ$ in fields from $\sim 40$ T to above 60 T. In this work, we studied the $H$ vs $\theta$ phase diagram at a base temperature of $\sim 0.6$ K as a function of Th concentration $x$ in U$_{1-x}$Th$_x$Te$_2$ pseudobinary compounds for $0.5\% \lesssim x \lesssim 4.7\%$. We find that for all values of $x$ within this range, the SC$_{\mathrm{LF}}$ phase is retained with a reduced value of $H_{c2}$ of $\sim 10$ T at $\phi = \theta = 0^\circ$ for $x = 4.7\%$, while the SC$_{\mathrm{HF}}$ phase is suppressed. The SC$_{\mathrm{FP}}$ and FP phases are unaffected to values of $x = 2\%$ but are completely suppressed in the region $x = 2.5$ to $4.7\%$ where the residual resistance ratio RRR has decreased from $\sim 14$ at $x = 1.5\%$ to values of $\sim 3$, indicating a significant increase in disorder.
AI Key Findings
Get AI-generated insights about this paper's methodology, results, significance, and more — seven facets brought into focus.
Impact
Authors
PDF Preview
Citation Network
Current paper (gray), citations (green), references (blue)
Display is limited for performance on very large graphs.
Discussion 0