Publication
Metrics
AI Quick Summary
This study investigates the high pressure-high temperature phase diagram of ammonia using diamond anvil cells and resistive heating, determining the III-IV transition line up to 20 GPa and 500 K without observing a III-IV-V triple point. The melting line is established up to 9 GPa and 900 K, and the experimental data fits well with a Simon-Glatzel equation.
Paper Preview
Abstract
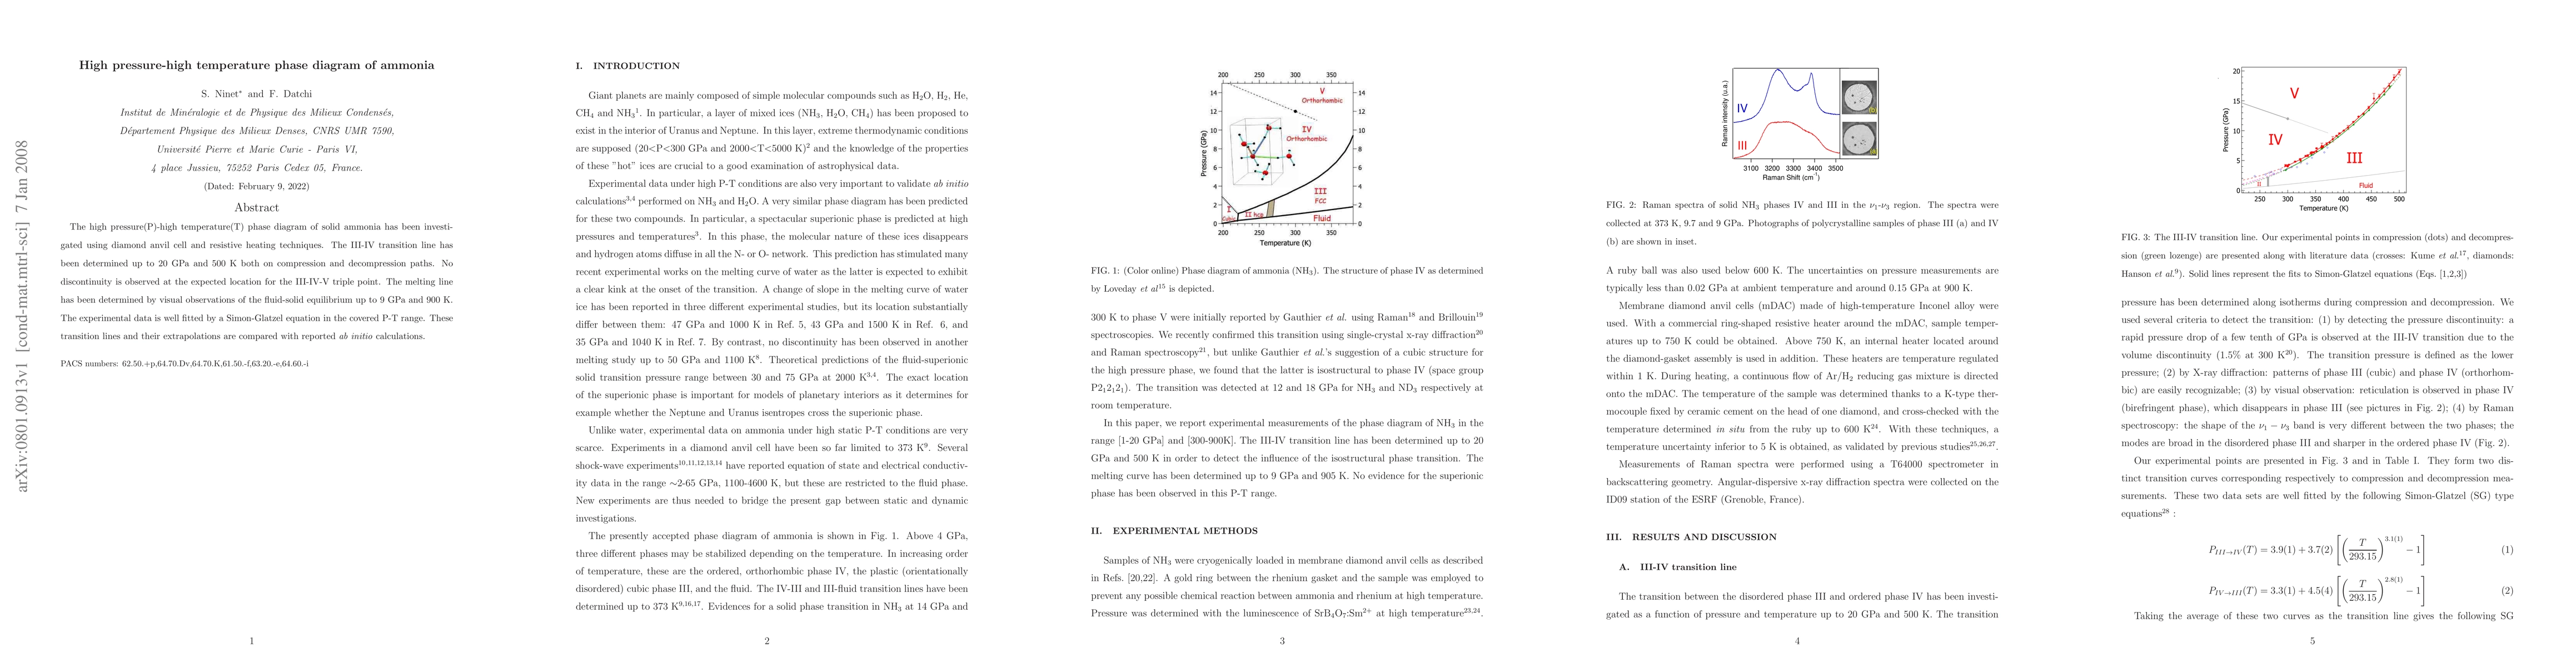
The high pressure(P)-high temperature(T) phase diagram of solid ammonia has been investigated using diamond anvil cell and resistive heating techniques. The III-IV transition line has been determined up to 20 GPa and 500 K both on compression and decompression paths. No discontinuity is observed at the expected location for the III-IV-V triple point. The melting line has been determined by visual observations of the fluid-solid equilibrium up to 9 GPa and 900 K. The experimental data is well fitted by a Simon-Glatzel equation in the covered P-T range. These transition lines and their extrapolations are compared with reported calculations.
AI Key Findings
Get AI-generated insights about this paper's methodology, results, significance, and more — seven facets brought into focus.
Impact
PDF Preview
Key Terms
Citation Network
Current paper (gray), citations (green), references (blue)
Display is limited for performance on very large graphs.
Discussion 0