Summary
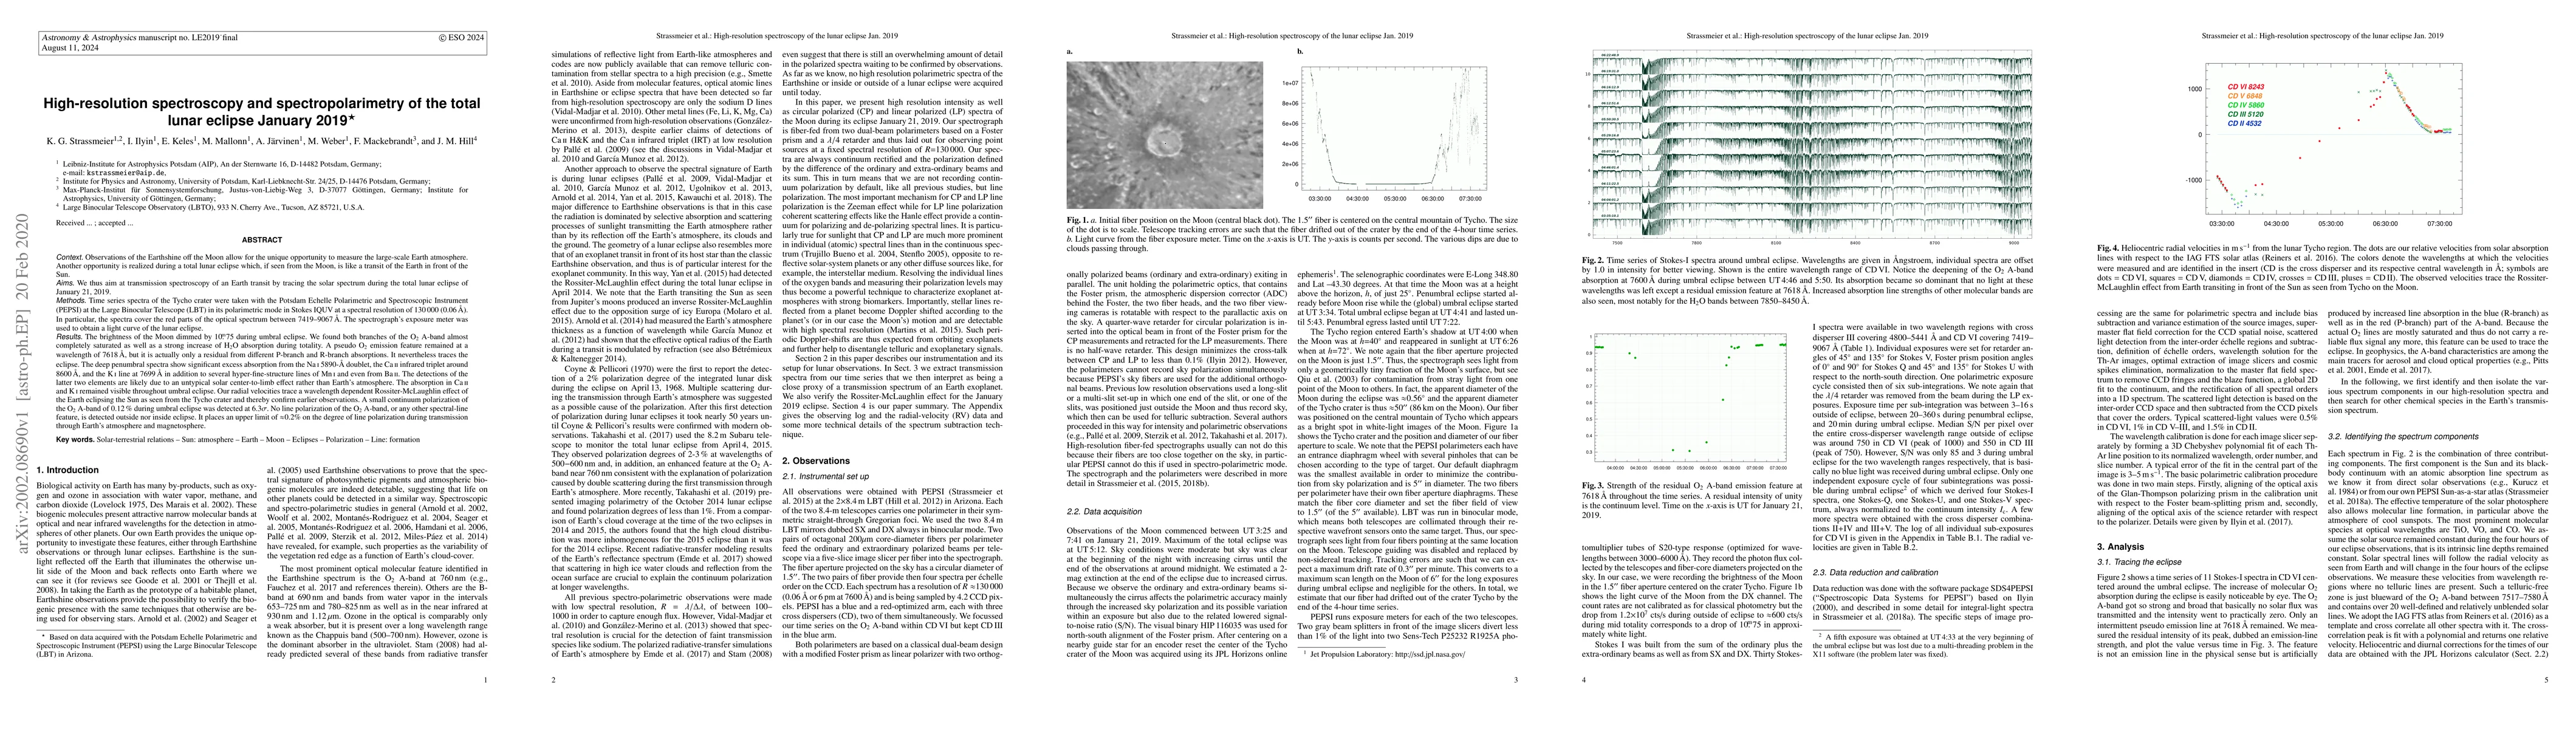
Observations of the Earthshine off the Moon allow for the unique opportunity to measure the large-scale Earth atmosphere. Another opportunity is realized during a total lunar eclipse which, if seen from the Moon, is like a transit of the Earth in front of the Sun. We thus aim at transmission spectroscopy of an Earth transit by tracing the solar spectrum during the total lunar eclipse of January 21, 2019. Time series spectra of the Tycho crater were taken with the Potsdam Echelle Polarimetric and Spectroscopic Instrument (PEPSI) at the Large Binocular Telescope (LBT) in its polarimetric mode in Stokes IQUV at a spectral resolution of 130000 (0.06 \AA). In particular, the spectra cover the red parts of the optical spectrum between 7419-9067 \AA . The spectrograph's exposure meter was used to obtain a light curve of the lunar eclipse. The brightness of the Moon dimmed by 10.75 mag during umbral eclipse. We found both branches of the O$_2$ A-band almost completely saturated as well as a strong increase of H$_2$O absorption during totality. The deep penumbral spectra show significant excess absorption from the NaI 5890 \AA doublet, the CaII infrared triplet around 8600 \AA, and the KI line at 7699 \AA in addition to several hyper-fine-structure lines of MnI and even from BaII. The detections of the latter two elements are likely due to an untypical solar center-to-limb effect rather than Earth's atmosphere. The absorption in CaII and KI remained visible throughout umbral eclipse. A small continuum polarization of the O$_2$ A-band of 0.12\% during umbral eclipse was detected at 6.3$\sigma$. No line polarization of the O$_2$ A-band, or any other spectral-line feature, is detected outside nor inside eclipse. It places an upper limit of $\approx$0.2\% on the degree of line polarization during transmission through Earth's atmosphere and magnetosphere.
AI Key Findings
Get AI-generated insights about this paper's methodology, results, and significance.
Paper Details
PDF Preview
Key Terms
Citation Network
Current paper (gray), citations (green), references (blue)
Display is limited for performance on very large graphs.
Similar Papers
Found 4 papers| Title | Authors | Year | Actions |
|---|
Comments (0)