Publication
Metrics
AI Quick Summary
Researchers found a non-trivial upper-bound on network throughput for homogeneous data center topologies, which is approached surprisingly closely by random graphs, leading to improved designs for heterogeneous networks with 43% higher throughput in real-world applications.
Paper Preview
Abstract
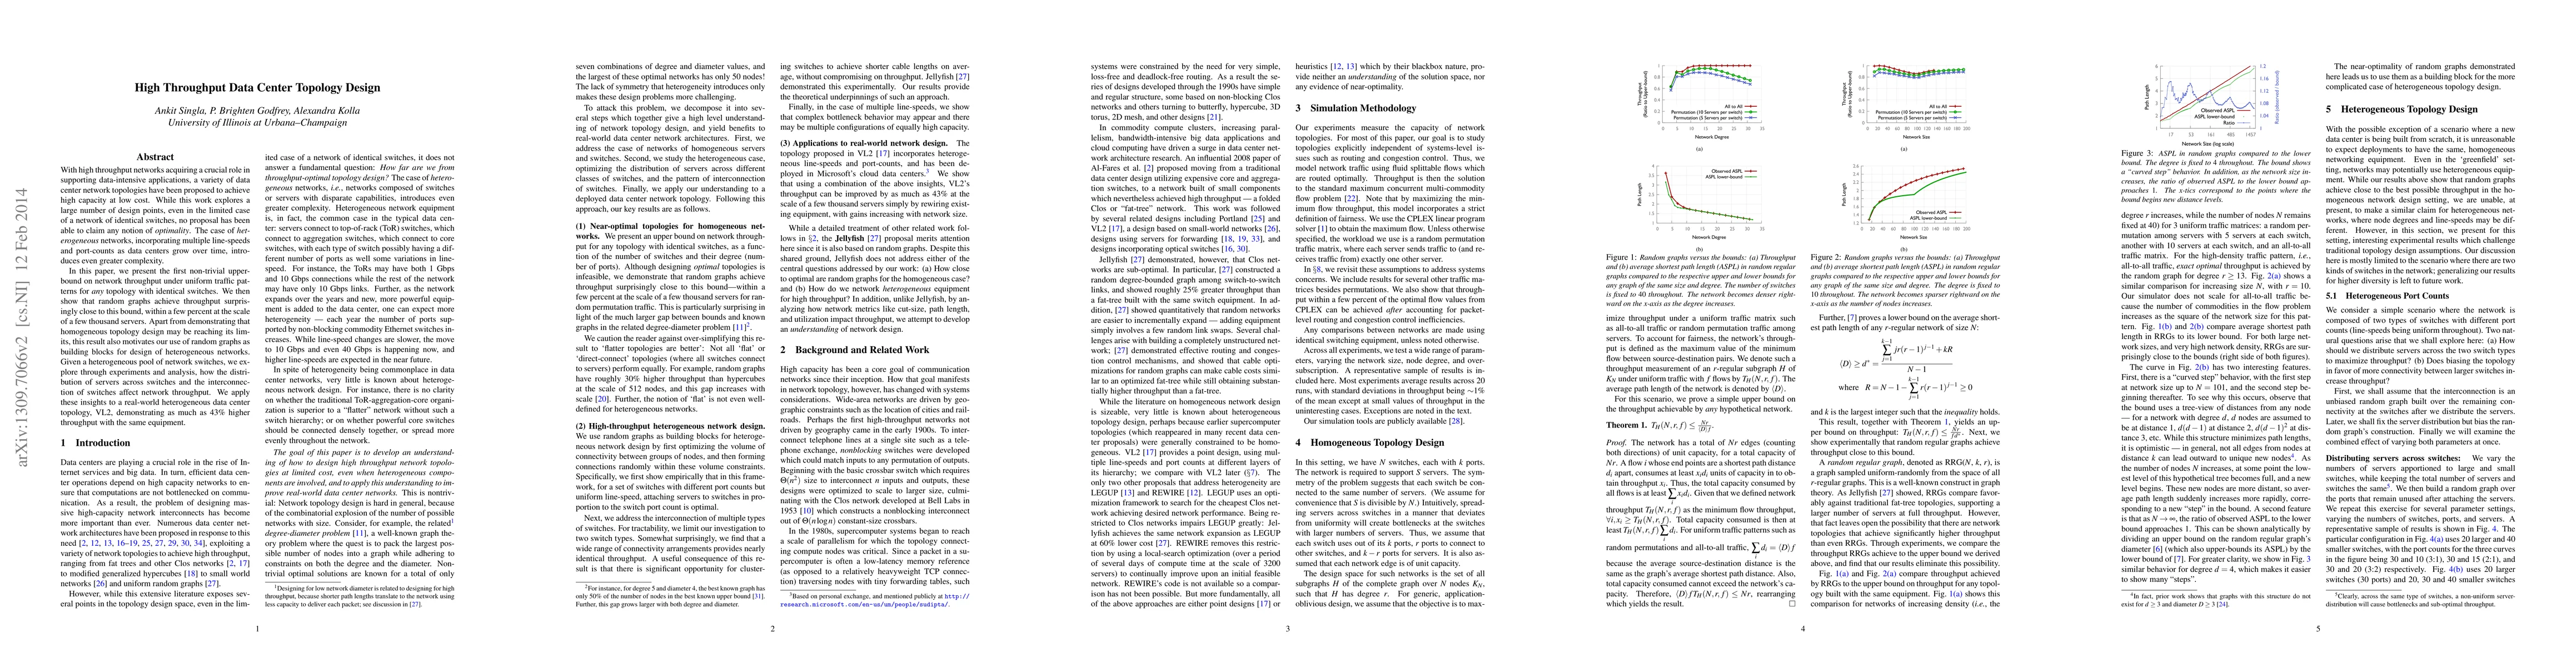
With high throughput networks acquiring a crucial role in supporting data-intensive applications, a variety of data center network topologies have been proposed to achieve high capacity at low cost. While this literature explores a large number of design points, even in the limited case of a network of identical switches, no proposal has been able to claim any notion of optimality. The case of heterogeneous networks, incorporating multiple line-speeds and port-counts as data centers grow over time, introduces even greater complexity. In this paper, we present the first non-trivial upper-bound on network throughput under uniform traffic patterns for any topology with identical switches. We then show that random graphs achieve throughput surprisingly close to this bound, within a few percent at the scale of a few thousand servers. Apart from demonstrating that homogeneous topology design may be reaching its limits, this result also motivates our use of random graphs as building blocks to explore the design of heterogeneous networks. Given a heterogeneous pool of network switches, through experiments and analysis, we explore how the distribution of servers across switches and the interconnection of switches affect network throughput. We apply these insights to a real-world heterogeneous data center topology, VL2, demonstrating as much as 43% higher throughput with the same equipment.
AI Key Findings
Get AI-generated insights about this paper's methodology, results, significance, and more — seven facets brought into focus.
Impact
Paper Details
PDF Preview
Key Terms
Citation Network
Current paper (gray), citations (green), references (blue)
Display is limited for performance on very large graphs.
Related Papers
No references found for this paper.
Discussion 0