Publication
Metrics
AI Quick Summary
This paper investigates high-velocity absorption features in the Type Ia supernova SN 2009ig, revealing a transition from high-velocity to photospheric-velocity lines. The study identifies unusual early-time spectra with multiple high-velocity lines, correlating these to a standard development sequence in Type Ia supernovae.
Paper Preview
Abstract
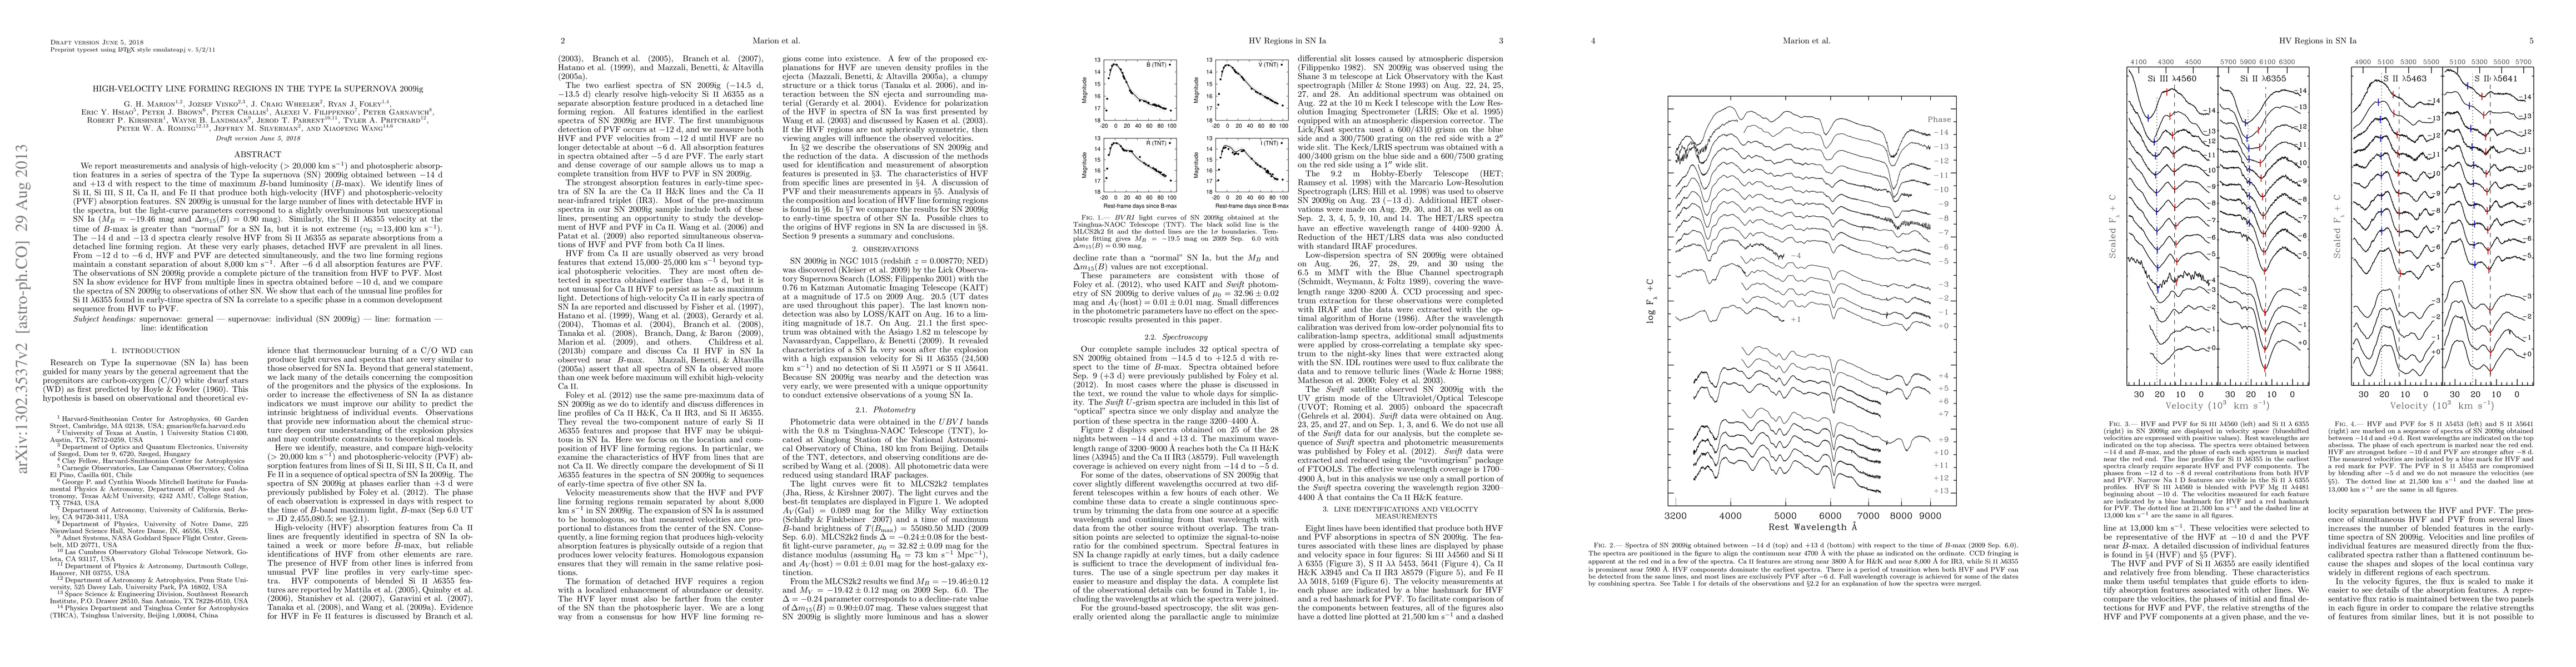
We report measurements and analysis of high-velocity (> 20,000 km/s) and photospheric absorption features in a series of spectra of the Type Ia supernova (SN) 2009ig obtained between -14d and +13d with respect to the time of maximum B-band luminosity. We identify lines of Si II, Si III, S II, Ca II and Fe II that produce both high-velocity (HVF) and photospheric-velocity (PVF) absorption features. SN 2009ig is unusual for the large number of lines with detectable HVF in the spectra, but the light-curve parameters correspond to a slightly overluminous but unexceptional SN Ia (M_B = -19.46 mag and Delta_m15 (B) = 0.90 mag). Similarly, the Si II lambda_6355 velocity at the time of B-max is greater than "normal" for a SN Ia, but it is not extreme (v_Si = 13,400 km/s). The -14d and -13d spectra clearly resolve HVF from Si II lambda_6355 as separate absorptions from a detached line forming region. At these very early phases, detached HVF are prevalent in all lines. From -12d to -6d, HVF and PVF are detected simultaneously, and the two line forming regions maintain a constant separation of about 8,000 km/s. After -6d all absorption features are PVF. The observations of SN 2009ig provide a complete picture of the transition from HVF to PVF. Most SN Ia show evidence for HVF from multiple lines in spectra obtained before -10d, and we compare the spectra of SN 2009ig to observations of other SN. We show that each of the unusual line profiles for Si II lambda_6355 found in early-time spectra of SN Ia correlate to a specific phase in a common development sequence from HVF to PVF.
AI Key Findings
Get AI-generated insights about this paper's methodology, results, significance, and more — seven facets brought into focus.
Impact
Paper Details
PDF Preview
Key Terms
Citation Network
Current paper (gray), citations (green), references (blue)
Display is limited for performance on very large graphs.
Discussion 0