Publication
Metrics
AI Quick Summary
This paper introduces methods for graphically identifying robust (sub)mm redshifts via emission lines and evaluates different (sub)mm practices for spectroscopic redshift measurements. It optimizes future (sub)mm observations to increase the fraction of reliable redshifts, emphasizing the importance of 2 mm for the z = 2-4 region using the Atacama Large Millimeter/submillimeter Array.
Paper Preview
Abstract
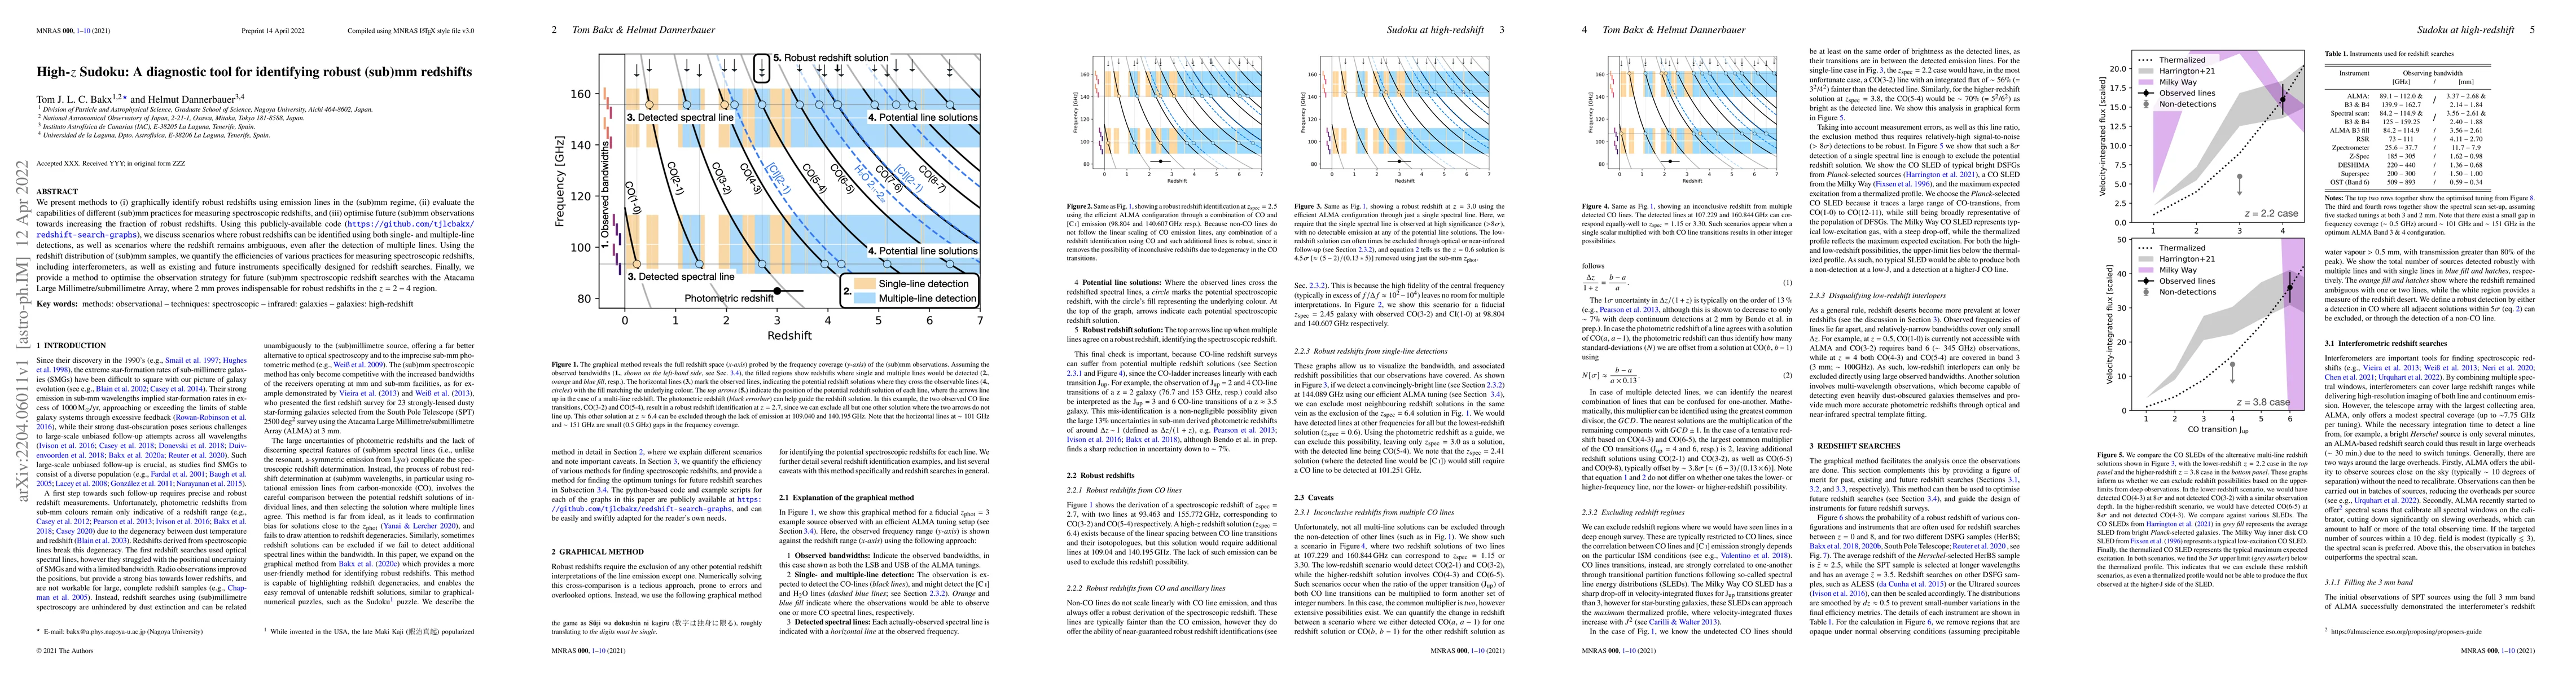
We present methods to (i) graphically identify robust redshifts using emission lines in the (sub)mm regime, (ii) evaluate the capabilities of different (sub)mm practices for measuring spectroscopic redshifts, and (iii) optimise future (sub)mm observations towards increasing the fraction of robust redshifts. Using this publicly-available code (https://github.com/tjlcbakx/redshift-search-graphs), we discuss scenarios where robust redshifts can be identified using both single- and multiple-line detections, as well as scenarios where the redshift remains ambiguous, even after the detection of multiple lines. Using the redshift distribution of (sub)mm samples, we quantify the efficiencies of various practices for measuring spectroscopic redshifts, including interferometers, as well as existing and future instruments specifically designed for redshift searches. Finally, we provide a method to optimise the observation strategy for future (sub)mm spectroscopic redshift searches with the Atacama Large Millimetre/submillimetre Array, where 2 mm proves indispensable for robust redshifts in the z = 2 - 4 region.
AI Key Findings
Get AI-generated insights about this paper's methodology, results, significance, and more — seven facets brought into focus.
Impact
Paper Details
Authors
PDF Preview
Key Terms
Citation Network
Current paper (gray), citations (green), references (blue)
Display is limited for performance on very large graphs.
Discussion 0