Histogram binning revisited with a focus on human perception
Publication
Metrics
AI Quick Summary
This study evaluates how well users perceive data distributions in histograms, revealing that more bins generally reduce errors but beyond a certain point, adding more bins does not improve accuracy. Existing mathematical models for histogram binning often overestimate the number of bins needed for human perception.
Paper Preview
Abstract
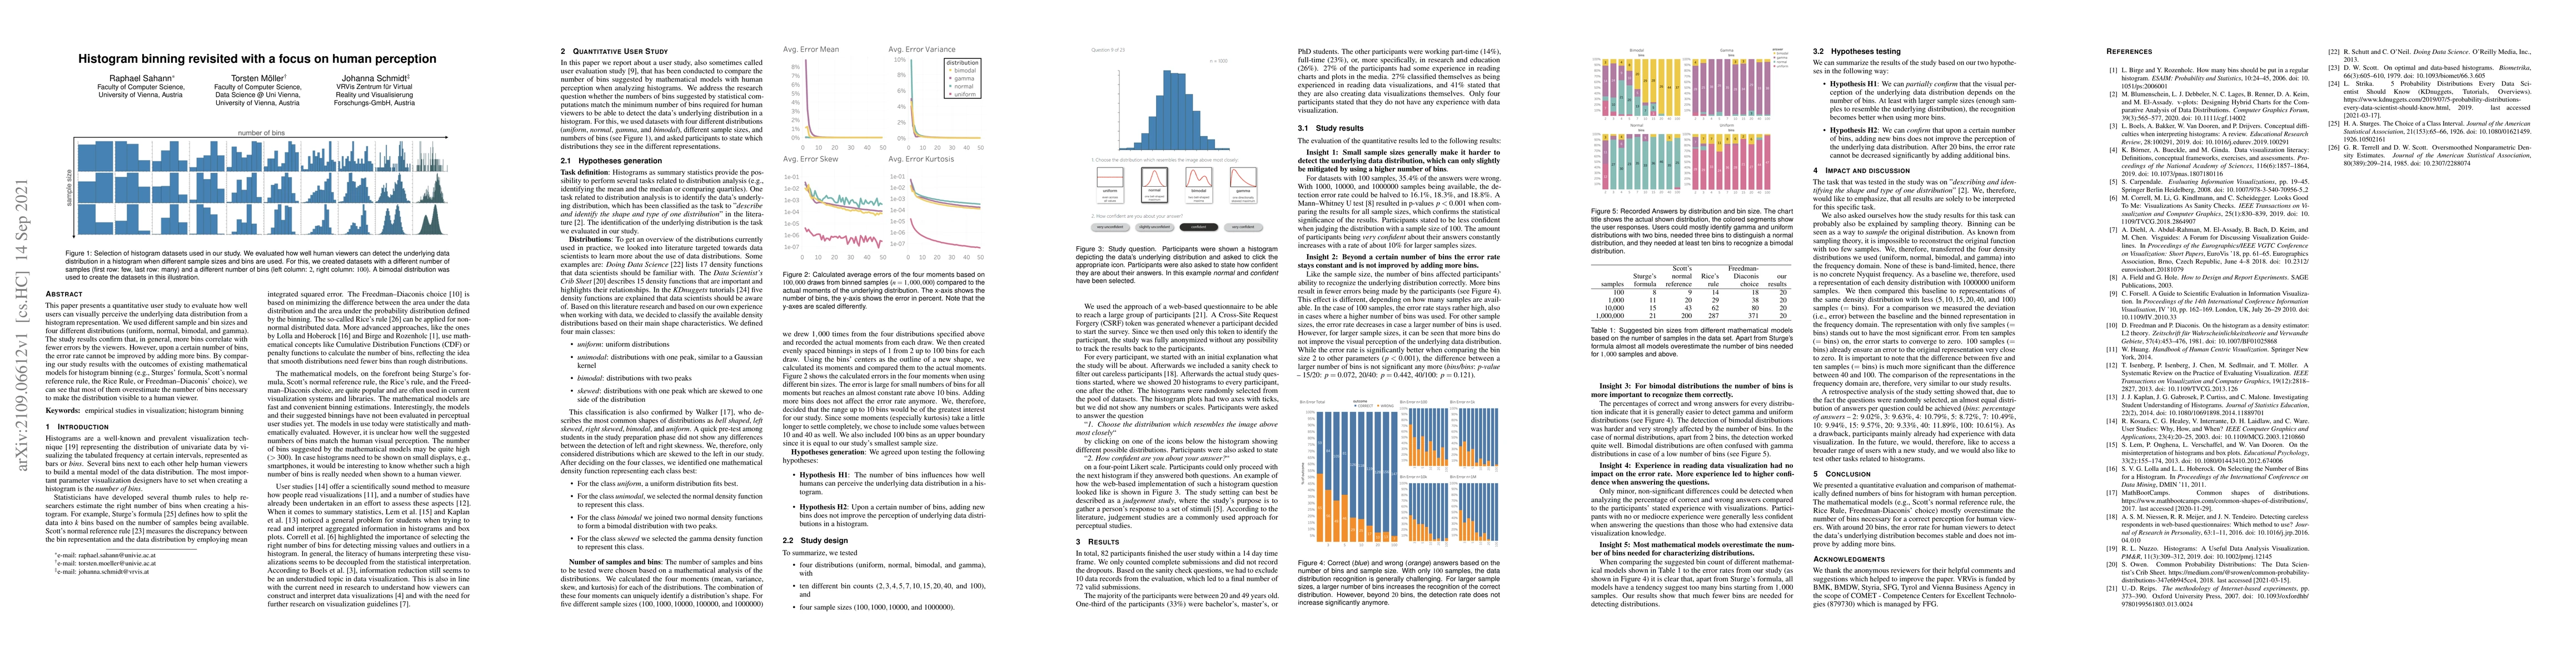
This paper presents a quantitative user study to evaluate how well users can visually perceive the underlying data distribution from a histogram representation. We used different sample and bin sizes and four different distributions (uniform, normal, bimodal, and gamma). The study results confirm that, in general, more bins correlate with fewer errors by the viewers. However, upon a certain number of bins, the error rate cannot be improved by adding more bins. By comparing our study results with the outcomes of existing mathematical models for histogram binning (e.g., Sturges' formula, Scott's normal reference rule, the Rice Rule, or Freedman-Diaconis' choice), we can see that most of them overestimate the number of bins necessary to make the distribution visible to a human viewer.
AI Key Findings
Get AI-generated insights about this paper's methodology, results, significance, and more — seven facets brought into focus.
Impact
Paper Details
Authors
PDF Preview
Key Terms
Citation Network
Current paper (gray), citations (green), references (blue)
Display is limited for performance on very large graphs.
Discussion 0