Histropy: A Computer Program for Quantifications of Histograms of 2D Gray-scale Images
Publication
Metrics
AI Quick Summary
"Histropy" is an interactive Python program for quantifying features in 2D grayscale images by analyzing pixel intensity histograms. It calculates Shannon entropy and root-mean-square contrast for selected histogram sections, and supports visual comparisons and output saving in PNG format.
Paper Preview
Abstract
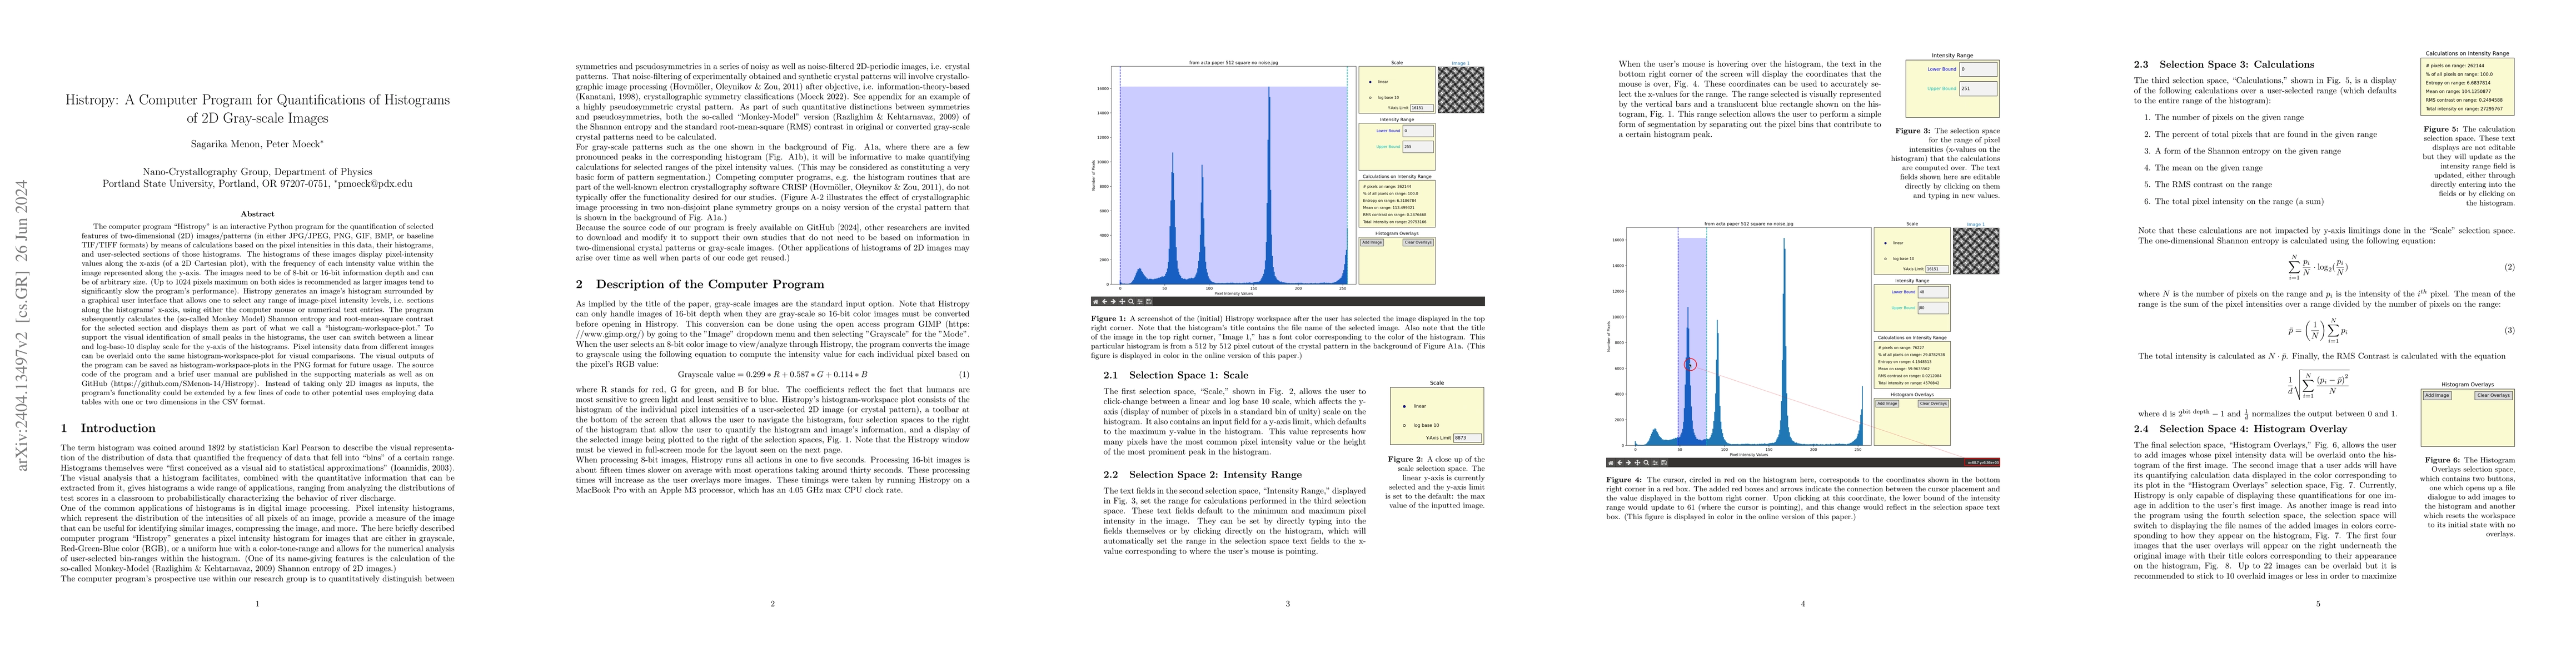
The computer program "Histropy" is an interactive Python program for the quantification of selected features of two-dimensional (2D) images/patterns (in either JPG/JPEG, PNG, GIF, BMP, or baseline TIF/TIFF formats) using calculations based on the pixel intensities in this data, their histograms, and user-selected sections of those histograms. The histograms of these images display pixel-intensity values along the x-axis (of a 2D Cartesian plot), with the frequency of each intensity value within the image represented along the y-axis. The images need to be of 8-bit or 16-bit information depth and can be of arbitrary size. Histropy generates an image's histogram surrounded by a graphical user interface that allows one to select any range of image-pixel intensity levels, i.e. sections along the histograms' x-axis, using either the computer mouse or numerical text entries. The program subsequently calculates the (so-called Monkey Model) Shannon entropy and root-mean-square contrast for the selected section and displays them as part of what we call a "histogram-workspace-plot." To support the visual identification of small peaks in the histograms, the user can switch between a linear and log-base-10 display scale for the y-axis of the histograms. Pixel intensity data from different images can be overlaid onto the same histogram-workspace-plot for visual comparisons. The visual outputs of the program can be saved as histogram-workspace-plots in the PNG format for future usage. The source code of the program and a brief user manual are published in the supporting materials as well as on GitHub. Instead of taking only 2D images as inputs, the program's functionality could be extended by a few lines of code to other potential uses employing data tables with one or two dimensions in the CSV format.
AI Key Findings
Get AI-generated insights about this paper's methodology, results, significance, and more — seven facets brought into focus.
Paper Details
Authors
PDF Preview
Key Terms
Related Papers
No references found for this paper.
Discussion 0