Publication
Metrics
AI Quick Summary
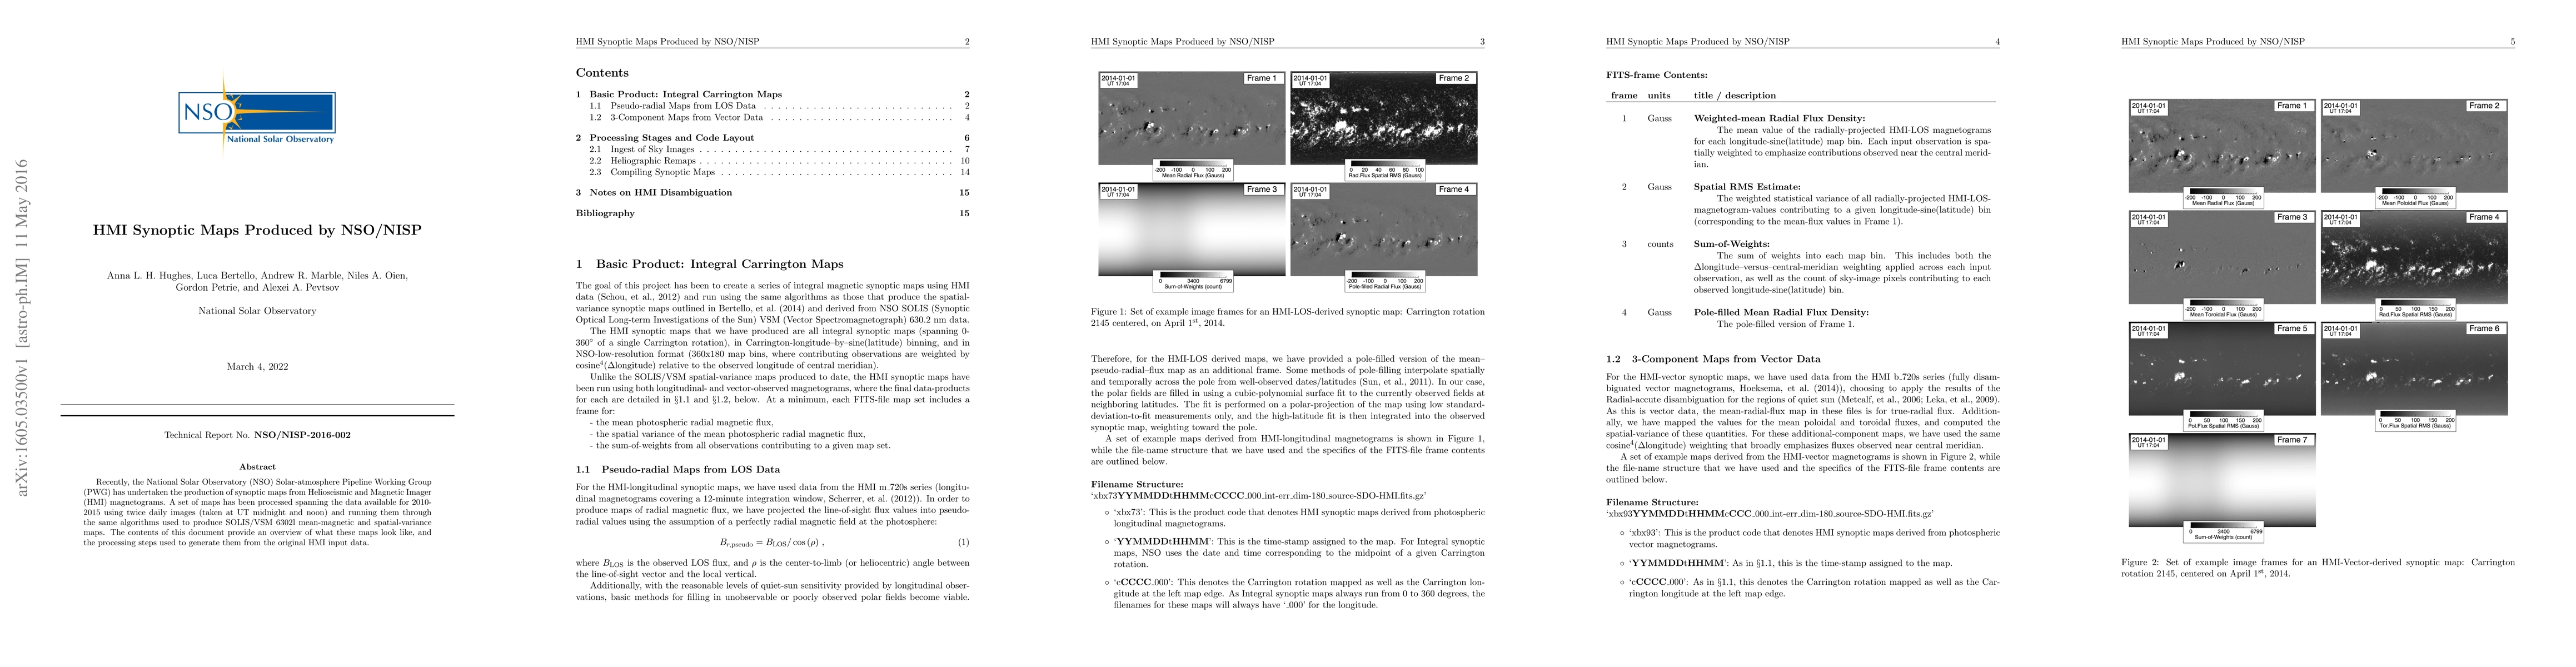
The National Solar Observatory (NSO) has produced synoptic maps from HMI magnetograms for 2010-2015 using algorithms similar to SOLIS/VSM. This document outlines the processing steps and visual characteristics of these newly generated maps.
Paper Preview
Abstract
Recently, the National Solar Observatory (NSO) Solar-atmosphere Pipeline Working Group has undertaken the production of synoptic maps from Helioseismic and Magnetic Imager (HMI) magnetograms. A set of maps has been processed spanning the data available for 2010-2015 using twice daily images (taken at UT midnight and noon) and running them through the same algorithms used to produce SOLIS/VSM 6302l mean-magnetic and spatial-variance maps. The contents of this document provide an overview of what these maps look like, and the processing steps used to generate them from the original HMI input data.
AI Key Findings
Get AI-generated insights about this paper's methodology, results, significance, and more — seven facets brought into focus.
Impact
Paper Details
PDF Preview
Key Terms
Citation Network
Current paper (gray), citations (green), references (blue)
Display is limited for performance on very large graphs.
Discussion 0