Homology-based Morphometry of Brain Atrophy: Methods and Applications
Publication
Metrics
AI Quick Summary
The paper introduces two topological data analysis pipelines using persistent homology to measure brain structure changes from T1-weighted MRI without heavy normalization. Pipeline 1 assesses cross-subject regional thinning, enabling AD vs. normal separation (AUC 0.895) with peaks in the medial temporal lobe, while Pipeline 2 tracks within-subject longitudinal changes, capturing sulcal widening and ventricular enlargement over time.
Paper Preview
Abstract
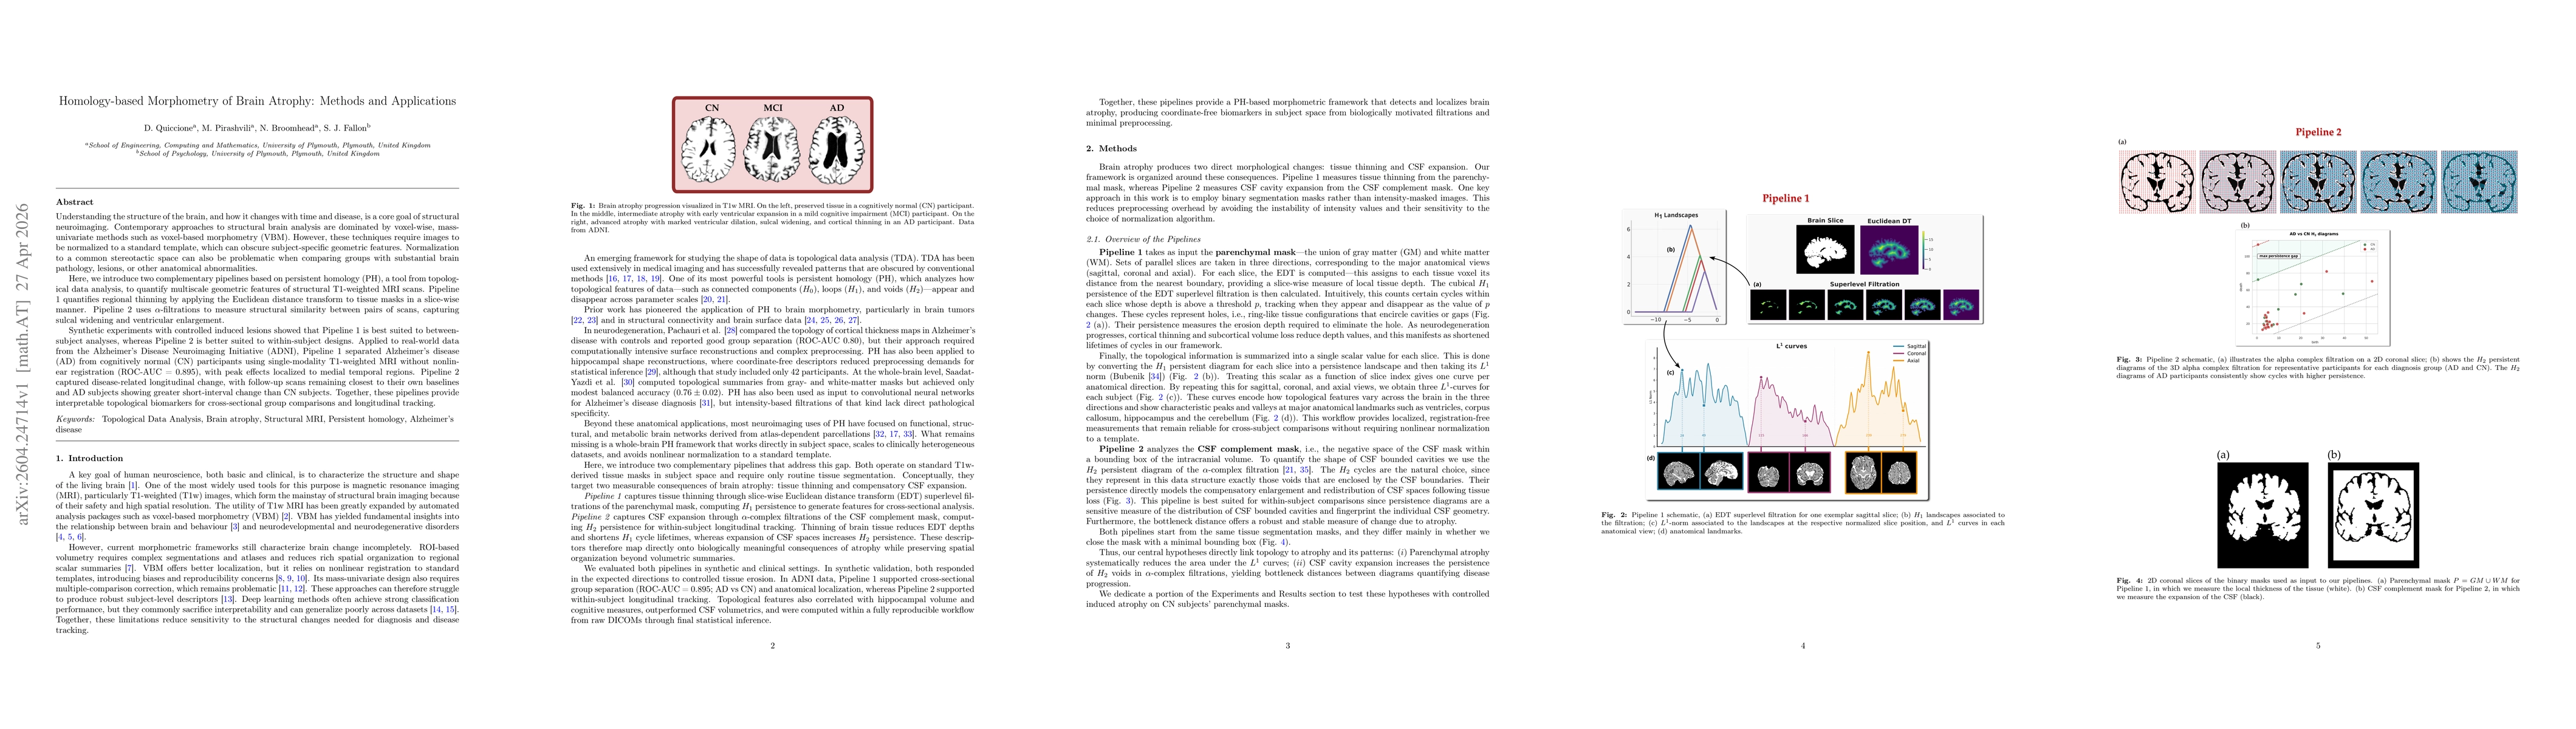
Understanding the structure of the brain, and how it changes with time and disease, is a core goal of structural neuroimaging. Contemporary approaches to structural brain analysis are dominated by voxel-wise, mass-univariate methods such as voxel-based morphometry (VBM). However, these techniques require images to be normalized to a standard template, which can obscure subject-specific geometric features. Normalization to a common stereotactic space can also be problematic when comparing groups with substantial brain pathology, lesions, or other anatomical abnormalities. Here, we introduce two complementary pipelines based on persistent homology (PH), a tool from topological data analysis, to quantify multiscale geometric features of structural T1-weighted MRI scans. Pipeline 1 quantifies regional thinning by applying the Euclidean distance transform to tissue masks in a slice-wise manner. Pipeline 2 uses \(α\)-filtrations to measure structural similarity between pairs of scans, capturing sulcal widening and ventricular enlargement. Synthetic experiments with controlled induced lesions showed that Pipeline 1 is best suited to between-subject analyses, whereas Pipeline 2 is better suited to within-subject designs. Applied to real-world data from the Alzheimer's Disease Neuroimaging Initiative (ADNI), Pipeline 1 separated Alzheimer's disease (AD) from cognitively normal (CN) participants using single-modality T1-weighted MRI without nonlinear registration (ROC-AUC = 0.895), with peak effects localized to medial temporal regions. Pipeline 2 captured disease-related longitudinal change, with follow-up scans remaining closest to their own baselines and AD subjects showing greater short-interval change than CN subjects. Together, these pipelines provide interpretable topological biomarkers for cross-sectional group comparisons and longitudinal tracking.
AI Key Findings
Get AI-generated insights about this paper's methodology, results, significance, and more — seven facets brought into focus.
Discussion 0