Summary
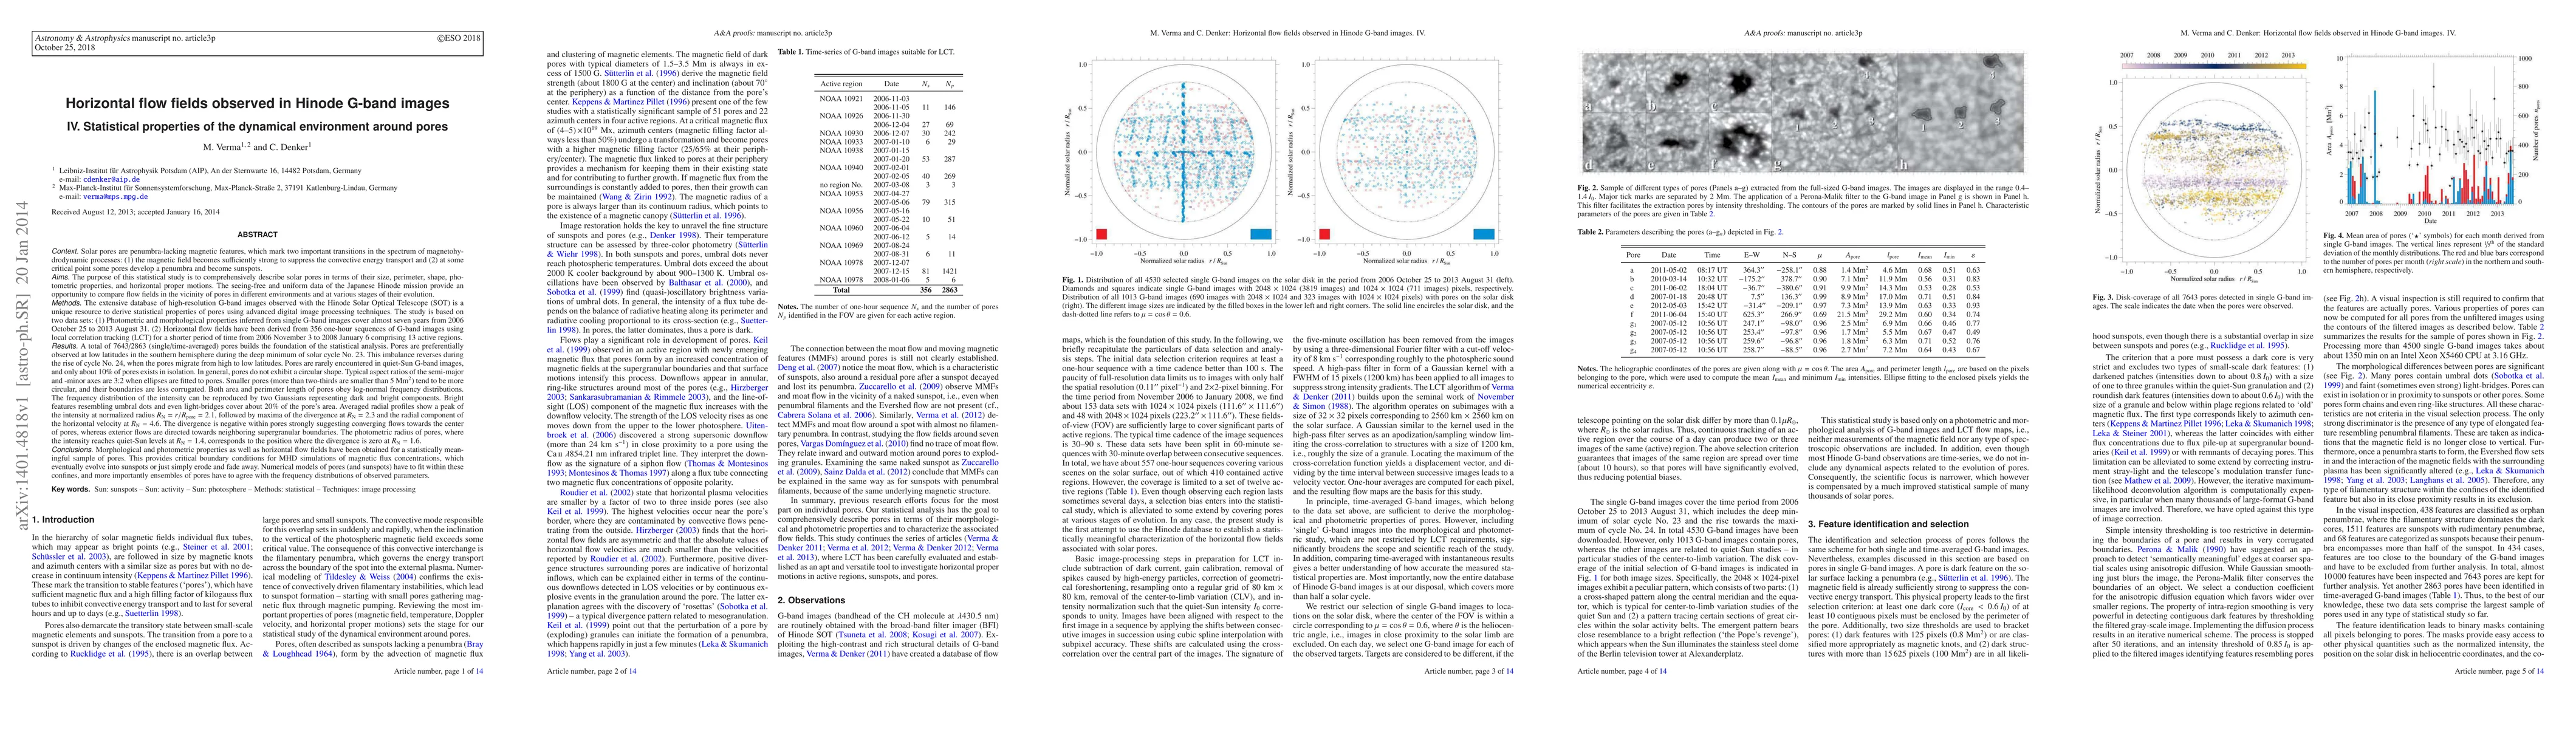
The extensive database of high-resolution G-band images observed with the Hinode/SOT is a unique resource to derive statistical properties of pores using advanced digital image processing techniques. The study is based on two data sets: (1) Photometric and morphological properties inferred from single G-band images cover almost seven years from 2006 October 25 to 2013 August 31. (2) Horizontal flow fields have been derived from 356 one-hour sequences of G-band images using LCT for a shorter period of time from 2006 November 3 to 2008 January 6 comprising 13 active regions. A total of 7643/2863 (single/time-averaged) pores builds the foundation of the statistical analysis. Pores are preferentially observed at low latitudes in the southern hemisphere during the deep minimum of solar cycle No. 23. This imbalance reverses during the rise of cycle No. 24, when the pores migrate from high to low latitudes. Pores are rarely encountered in quiet-Sun G-band images, and only about 10% of pores exists in isolation. In general, pores do not exhibit a circular shape. Typical aspect ratios of the semi-major and -minor axes are 3:2 when ellipses are fitted to pores. Smaller pores (more than two-thirds are smaller than 5~Mm^2) tend to be more circular, and their boundaries are less corrugated. Both area and perimeter length of pores obey log-normal frequency distributions. The frequency distribution of the intensity can be reproduced by two Gaussians representing dark and bright components. Bright features resembling umbral dots and even light-bridges cover about 20% of the pore's area. Averaged radial profiles show a peak of the intensity at normalized radius R_N = r /R_pore = 2.1, followed by maxima of the divergence at R_N= 2.3 and the radial component of the horizontal velocity at R_N= 4.6. The divergence is negative within pores.
AI Key Findings
Get AI-generated insights about this paper's methodology, results, and significance.
Paper Details
PDF Preview
Key Terms
Citation Network
Current paper (gray), citations (green), references (blue)
Display is limited for performance on very large graphs.
| Title | Authors | Year | Actions |
|---|
Comments (0)