How Dataflow Diagrams Impact Software Security Analysis: an Empirical Experiment
Publication
Metrics
AI Quick Summary
This paper reports an empirical experiment investigating the impact of dataflow diagrams (DFDs) on software security analysis. Results showed a 41% increase in analysis correctness when participants used DFDs compared to examining source code alone, highlighting the benefits of model-supported analysis.
Paper Preview
Abstract
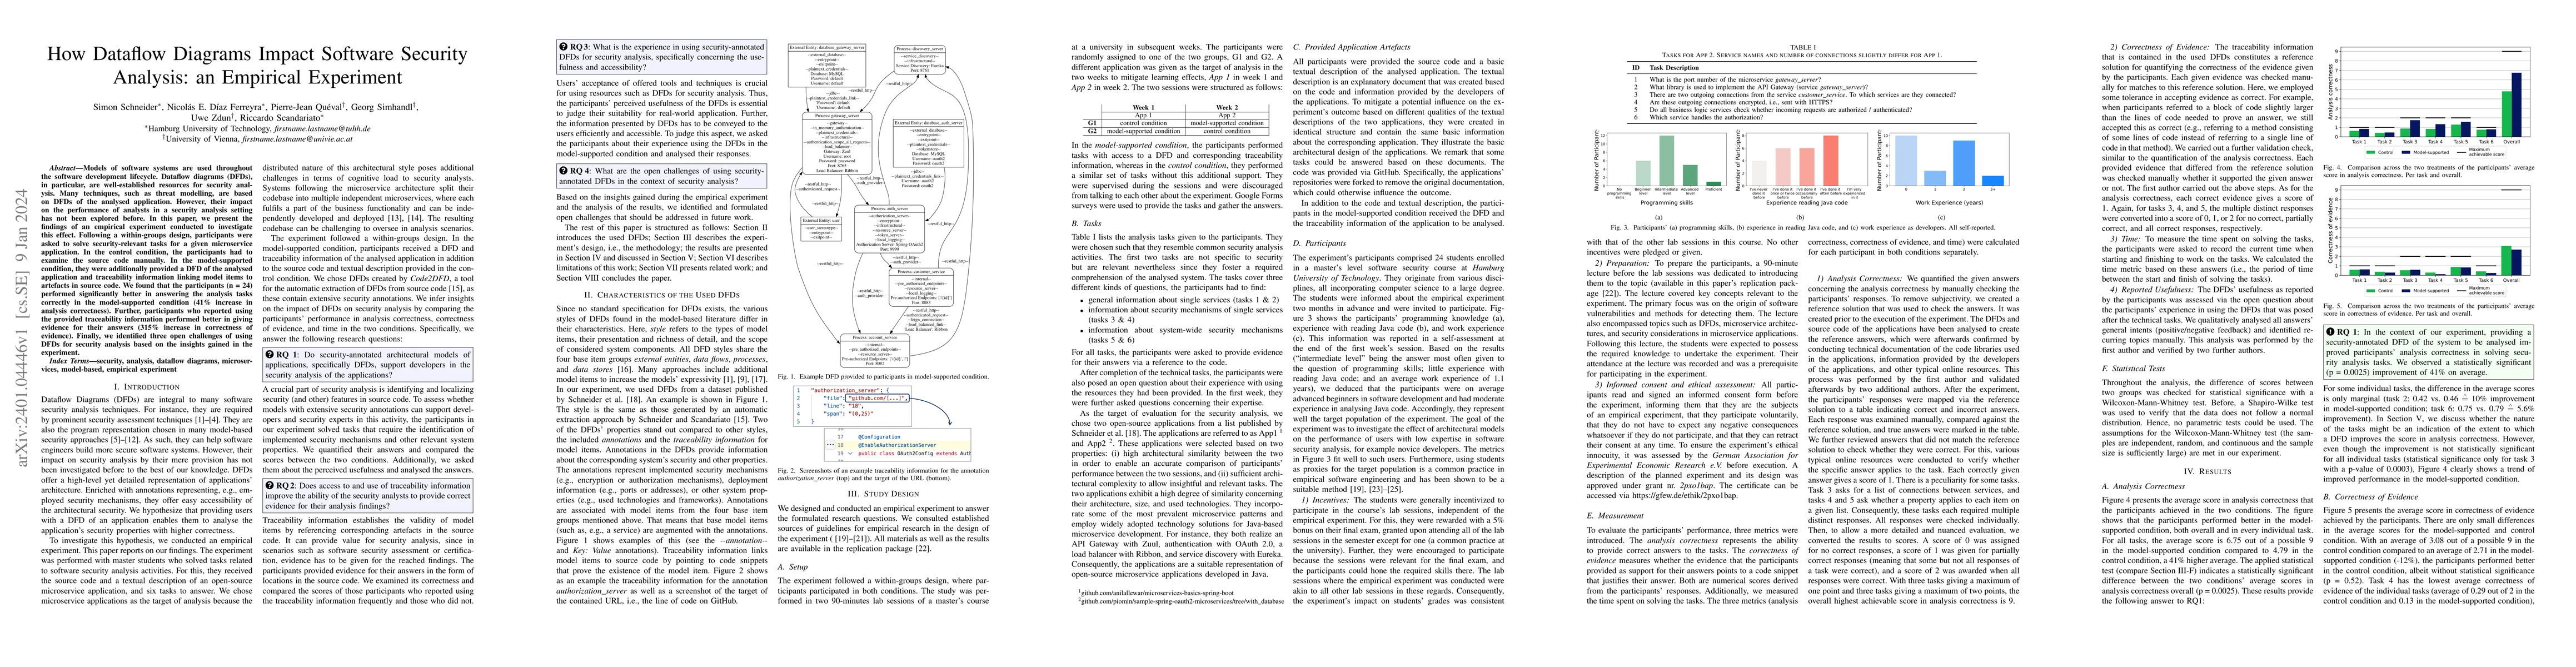
Models of software systems are used throughout the software development lifecycle. Dataflow diagrams (DFDs), in particular, are well-established resources for security analysis. Many techniques, such as threat modelling, are based on DFDs of the analysed application. However, their impact on the performance of analysts in a security analysis setting has not been explored before. In this paper, we present the findings of an empirical experiment conducted to investigate this effect. Following a within-groups design, participants were asked to solve security-relevant tasks for a given microservice application. In the control condition, the participants had to examine the source code manually. In the model-supported condition, they were additionally provided a DFD of the analysed application and traceability information linking model items to artefacts in source code. We found that the participants (n = 24) performed significantly better in answering the analysis tasks correctly in the model-supported condition (41% increase in analysis correctness). Further, participants who reported using the provided traceability information performed better in giving evidence for their answers (315% increase in correctness of evidence). Finally, we identified three open challenges of using DFDs for security analysis based on the insights gained in the experiment.
AI Key Findings
Get AI-generated insights about this paper's methodology, results, significance, and more — seven facets brought into focus.
Impact
Paper Details
Authors
PDF Preview
Key Terms
Citation Network
Current paper (gray), citations (green), references (blue)
Display is limited for performance on very large graphs.
Discussion 0