Publication
Metrics
AI Quick Summary
This study investigates how captions influence readers' understanding of line charts by varying the visual salience and semantic level of the described features. Results show that primary salient features in single-line charts are better recalled when described statistically, while perceptual descriptions are more memorable for both primary and secondary features in multi-line charts. Captions also tend to make readers recall specific numerical values on the y-axis.
Paper Preview
Abstract
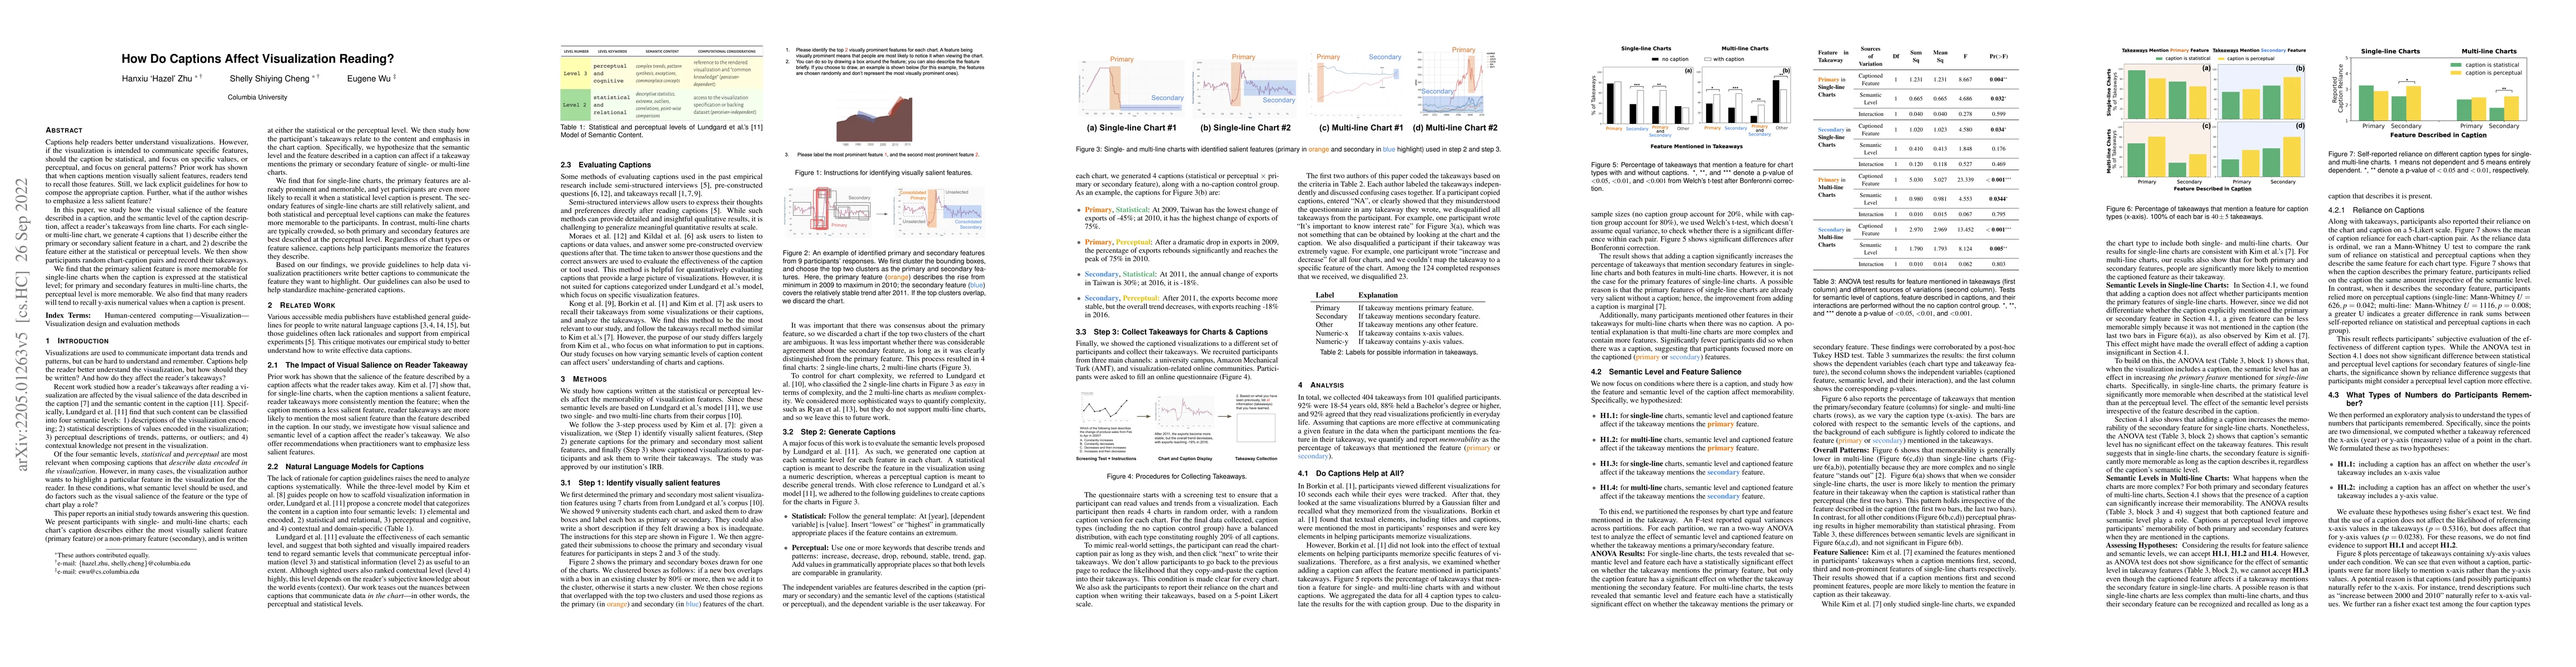
Captions help readers better understand visualizations. However, if the visualization is intended to communicate specific features, should the caption be statistical, and focus on specific values, or perceptual, and focus on general patterns? Prior work has shown that when captions mention visually salient features, readers tend to recall those features. Still, we lack explicit guidelines for how to compose the appropriate caption. Further, what if the author wishes to emphasize a less salient feature? In this paper, we study how the visual salience of the feature described in a caption, and the semantic level of the caption description, affect a reader's takeaways from line charts. For each single- or multi-line chart, we generate 4 captions that 1) describe either the primary or secondary salient feature in a chart, and 2) describe the feature either at the statistical or perceptual levels. We then show participants random chart-caption pairs and record their takeaways. We find that the primary salient feature is more memorable for single-line charts when the caption is expressed at the statistical level; for primary and secondary features in multi-line charts, the perceptual level is more memorable. We also find that many readers will tend to recall y-axis numerical values when a caption is present.
AI Key Findings
Get AI-generated insights about this paper's methodology, results, significance, and more — seven facets brought into focus.
Impact
Paper Details
Authors
PDF Preview
Key Terms
Citation Network
Current paper (gray), citations (green), references (blue)
Display is limited for performance on very large graphs.
Discussion 0