Summary
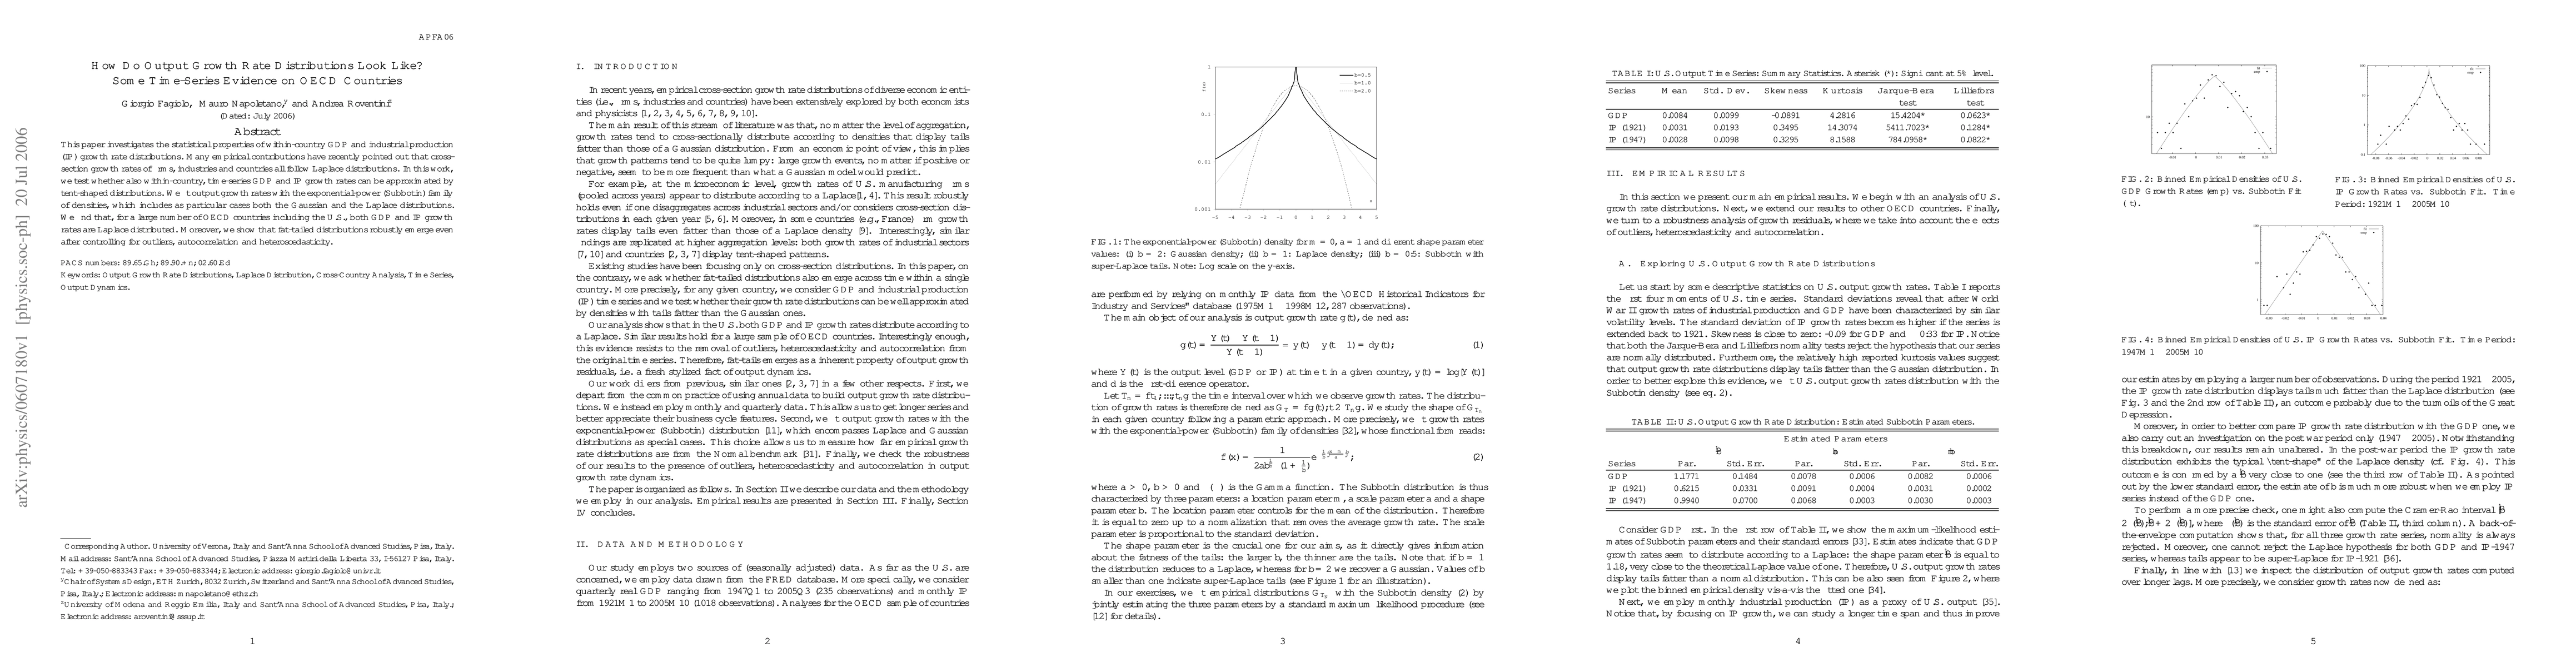
This paper investigates the statistical properties of within-country GDP and industrial production (IP) growth rate distributions. Many empirical contributions have recently pointed out that cross-section growth rates of firms, industries and countries all follow Laplace distributions. In this work, we test whether also within-country, time-series GDP and IP growth rates can be approximated by tent-shaped distributions. We fit output growth rates with the exponential-power (Subbotin) family of densities, which includes as particular cases both the Gaussian and the Laplace distributions. We find that, for a large number of OECD countries including the U.S., both GDP and IP growth rates are Laplace distributed. Moreover, we show that fat-tailed distributions robustly emerge even after controlling for outliers, autocorrelation and heteroscedasticity.
AI Key Findings
Get AI-generated insights about this paper's methodology, results, and significance.
Paper Details
PDF Preview
Similar Papers
Found 4 papersGrowth-rate distributions of gut microbiota time series: neutral models and temporal dependence
E. Brigatti, S. Azaele
Forecasting exports in selected OECD countries and Iran using MLP Artificial Neural Network
Soheila Khajoui, Saeid Dehyadegari, Sayyed Abdolmajid Jalaee
Comments (0)