How Does Automation Shape the Process of Narrative Visualization: A Survey of Tools
Publication
Metrics
AI Quick Summary
This paper surveys the current landscape of narrative visualization tools, categorizing them into six genres and four types based on automation levels. It aims to provide an overview of how automation aids in the creation process, highlighting key research problems and suggesting new research opportunities.
Paper Preview
Abstract
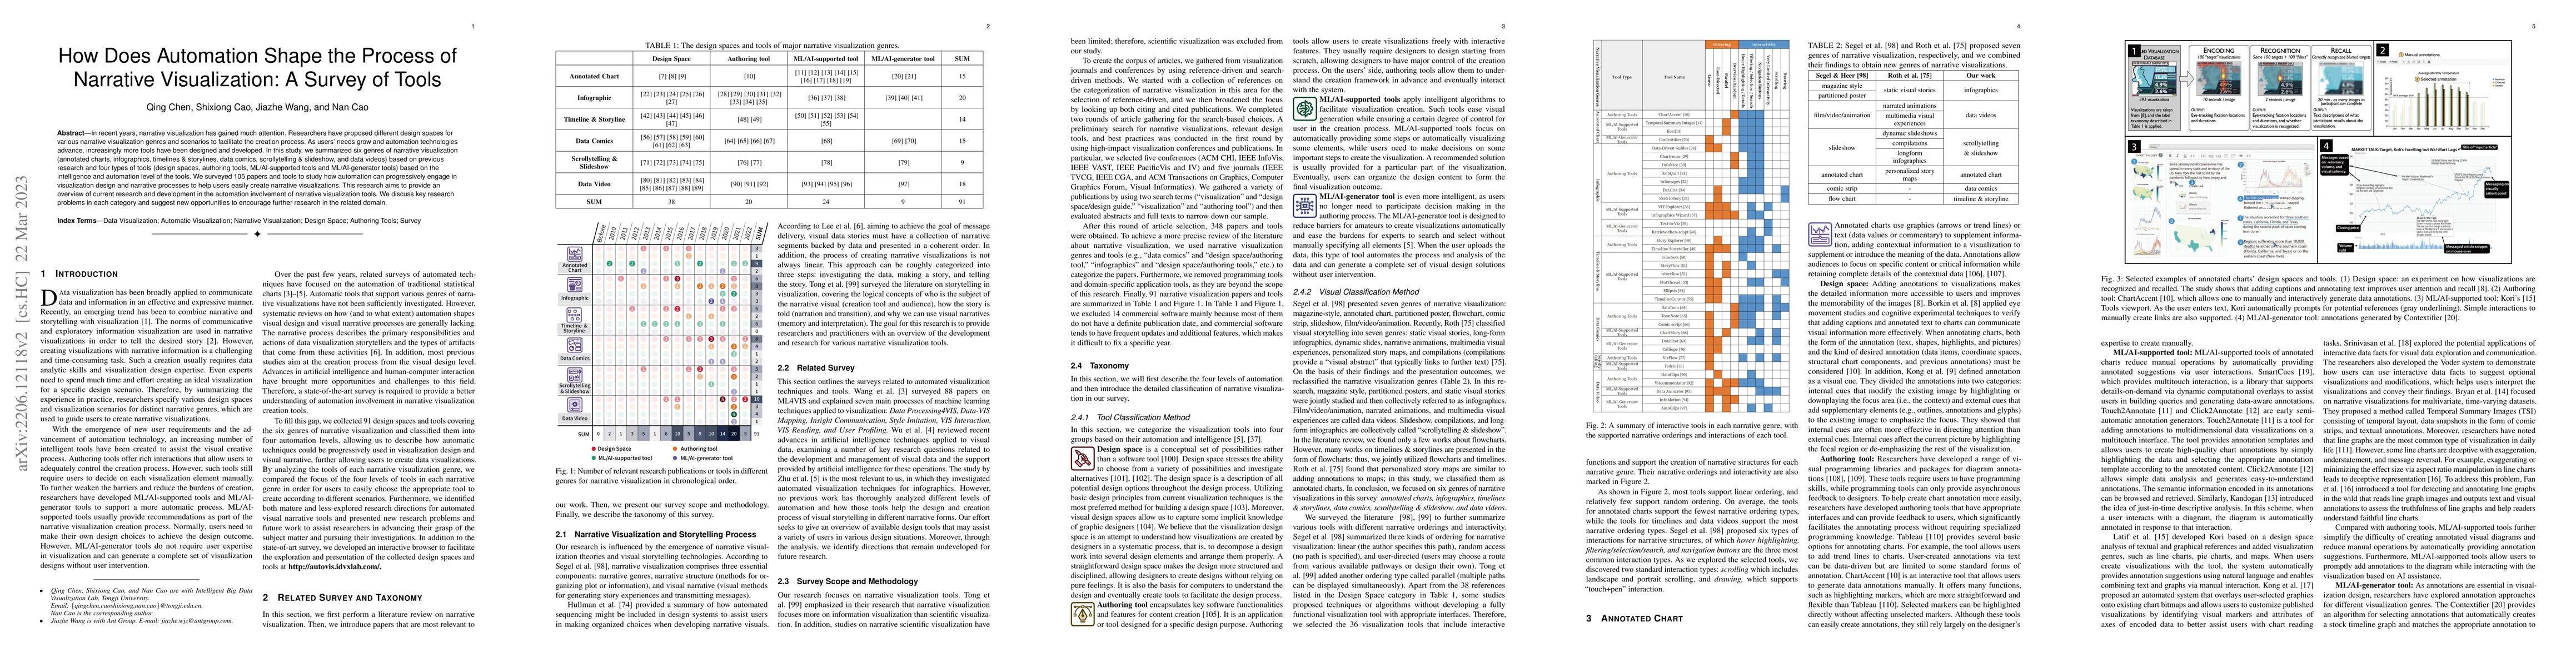
In recent years, narrative visualization has gained much attention. Researchers have proposed different design spaces for various narrative visualization genres and scenarios to facilitate the creation process. As users' needs grow and automation technologies advance, increasingly more tools have been designed and developed. In this study, we summarized six genres of narrative visualization (annotated charts, infographics, timelines & storylines, data comics, scrollytelling & slideshow, and data videos) based on previous research and four types of tools (design spaces, authoring tools, ML/AI-supported tools and ML/AI-generator tools) based on the intelligence and automation level of the tools. We surveyed 105 papers and tools to study how automation can progressively engage in visualization design and narrative processes to help users easily create narrative visualizations. This research aims to provide an overview of current research and development in the automation involvement of narrative visualization tools. We discuss key research problems in each category and suggest new opportunities to encourage further research in the related domain.
AI Key Findings
Get AI-generated insights about this paper's methodology, results, significance, and more — seven facets brought into focus.
Impact
Paper Details
Authors
PDF Preview
Key Terms
Citation Network
Current paper (gray), citations (green), references (blue)
Display is limited for performance on very large graphs.
Discussion 0