How the reversible change of contact network affects the epidemic spreading
Publication
Metrics
AI Quick Summary
This study examines how reversible changes in contact networks, like mobility patterns during the COVID-19 pandemic, affect epidemic spreading using a time-varying SIR model. It reveals that an optimal freezing rate of links exists for minimizing epidemic prevalence, challenging the notion that stricter measures always yield better outcomes.
Paper Preview
Abstract
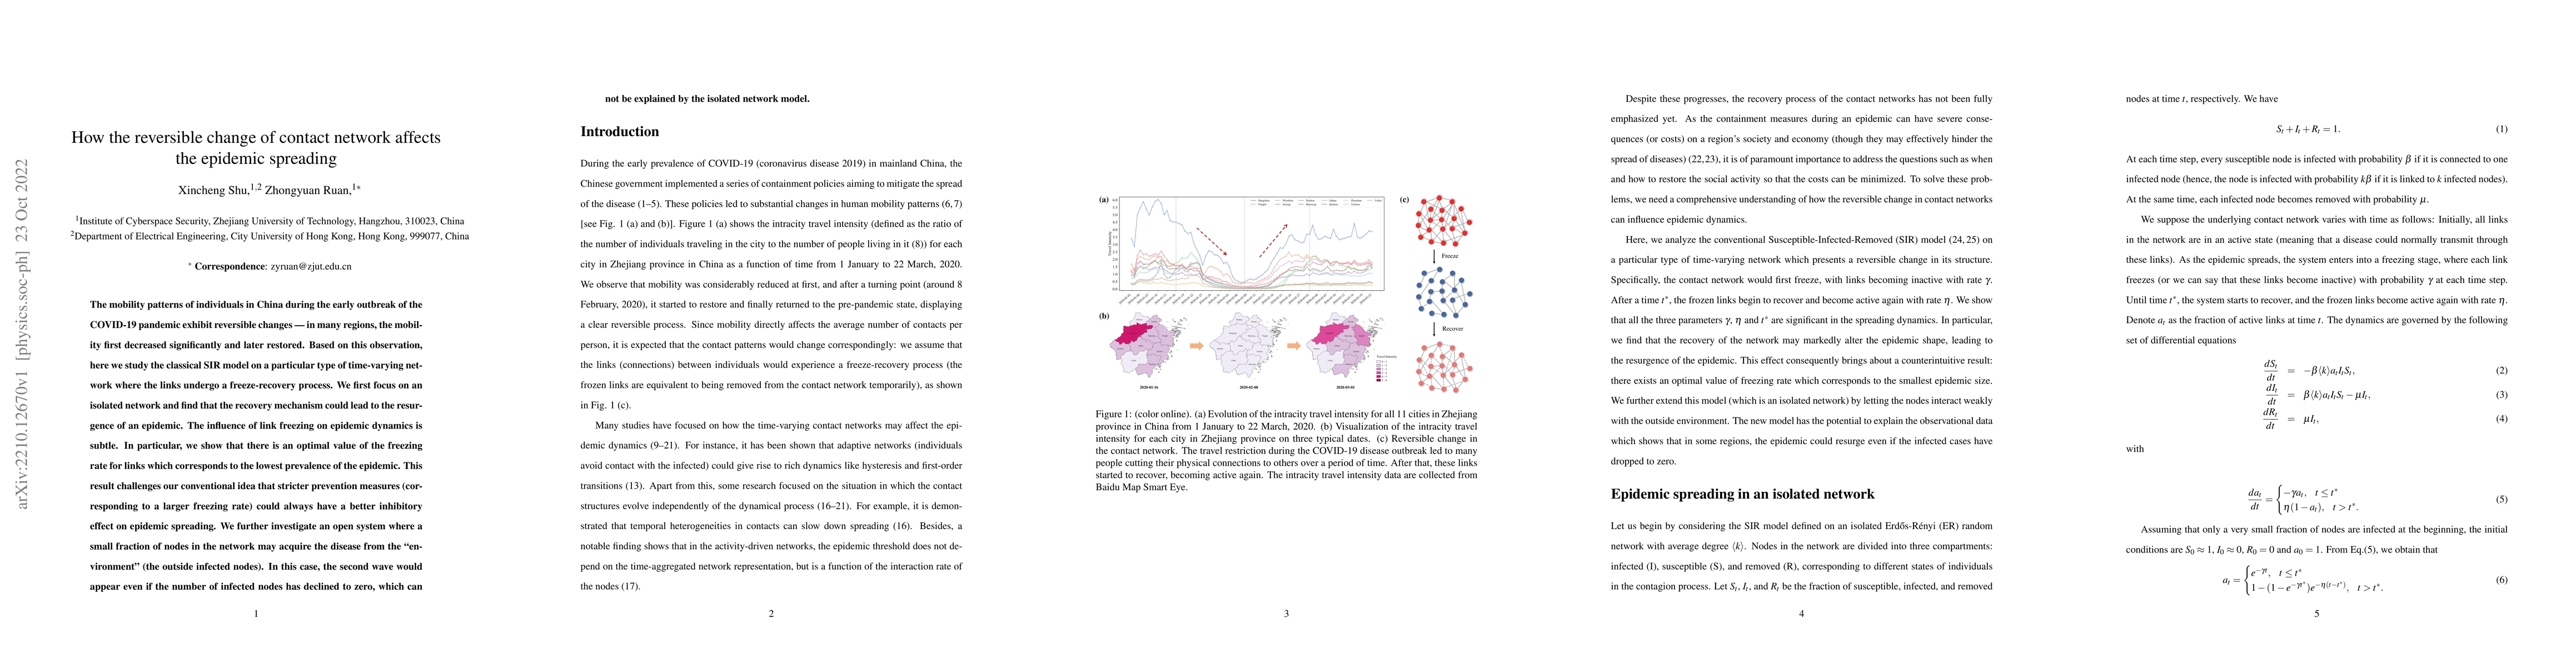
The mobility patterns of individuals in China during the early outbreak of the COVID-19 pandemic exhibit reversible changes -- in many regions, the mobility first decreased significantly and later restored. Based on this observation, here we study the classical SIR model on a particular type of time-varying network where the links undergo a freeze-recovery process. We first focus on an isolated network and find that the recovery mechanism could lead to the resurgence of an epidemic. The influence of link freezing on epidemic dynamics is subtle. In particular, we show that there is an optimal value of the freezing rate for links which corresponds to the lowest prevalence of the epidemic. This result challenges our conventional idea that stricter prevention measures (corresponding to a larger freezing rate) could always have a better inhibitory effect on epidemic spreading. We further investigate an open system where a small fraction of nodes in the network may acquire the disease from the "environment" (the outside infected nodes). In this case, the second wave would appear even if the number of infected nodes has declined to zero, which can not be explained by the isolated network model.
AI Key Findings
Get AI-generated insights about this paper's methodology, results, significance, and more — seven facets brought into focus.
Impact
Paper Details
Authors
PDF Preview
Key Terms
Citation Network
Current paper (gray), citations (green), references (blue)
Display is limited for performance on very large graphs.
Discussion 0