How to Read Many-Objective Solution Sets in Parallel Coordinates
Publication
Metrics
AI Quick Summary
This paper explores the use of parallel coordinates for visualizing high-dimensional many-objective optimization solution sets, offering insights into comparing solution quality, understanding solution set distribution, and reflecting objective relationships. It aims to provide guidelines for effectively using parallel coordinates in evolutionary many-objective optimization.
Paper Preview
Abstract
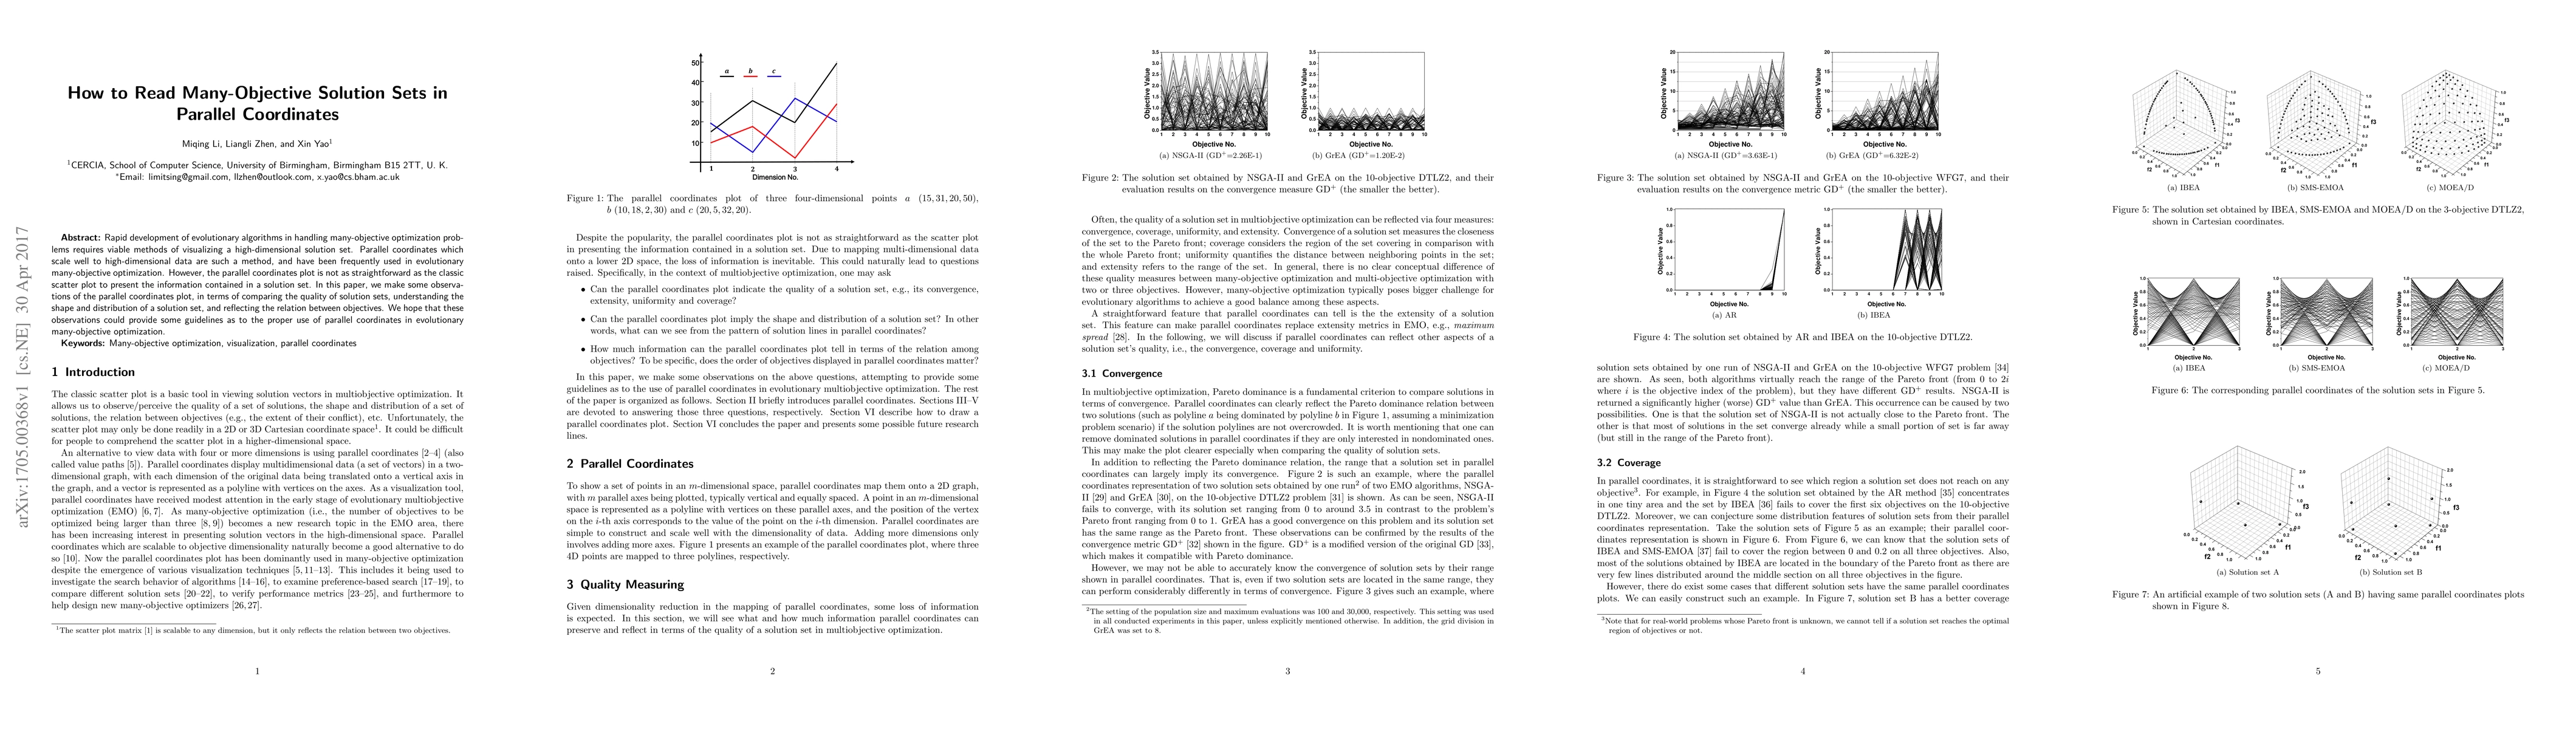
Rapid development of evolutionary algorithms in handling many-objective optimization problems requires viable methods of visualizing a high-dimensional solution set. Parallel coordinates which scale well to high-dimensional data are such a method, and have been frequently used in evolutionary many-objective optimization. However, the parallel coordinates plot is not as straightforward as the classic scatter plot to present the information contained in a solution set. In this paper, we make some observations of the parallel coordinates plot, in terms of comparing the quality of solution sets, understanding the shape and distribution of a solution set, and reflecting the relation between objectives. We hope that these observations could provide some guidelines as to the proper use of parallel coordinates in evolutionary many-objective optimization.
AI Key Findings
Get AI-generated insights about this paper's methodology, results, significance, and more — seven facets brought into focus.
Impact
Paper Details
PDF Preview
Key Terms
Citation Network
Current paper (gray), citations (green), references (blue)
Display is limited for performance on very large graphs.
Discussion 0