Publication
Metrics
AI Quick Summary
This paper analyzes historical measurements of the Hubble-Lemaître constant $H_0$ and finds that error bars have been underestimated in 15-20% of cases, potentially explaining the Hubble tension. The study recalibrates the probabilities to show that the 4.4$\sigma$ tension between local and cosmic microwave background data is equivalent to a 2.1$\sigma$ tension, reducing the significance of the discrepancy.
Paper Preview
Abstract
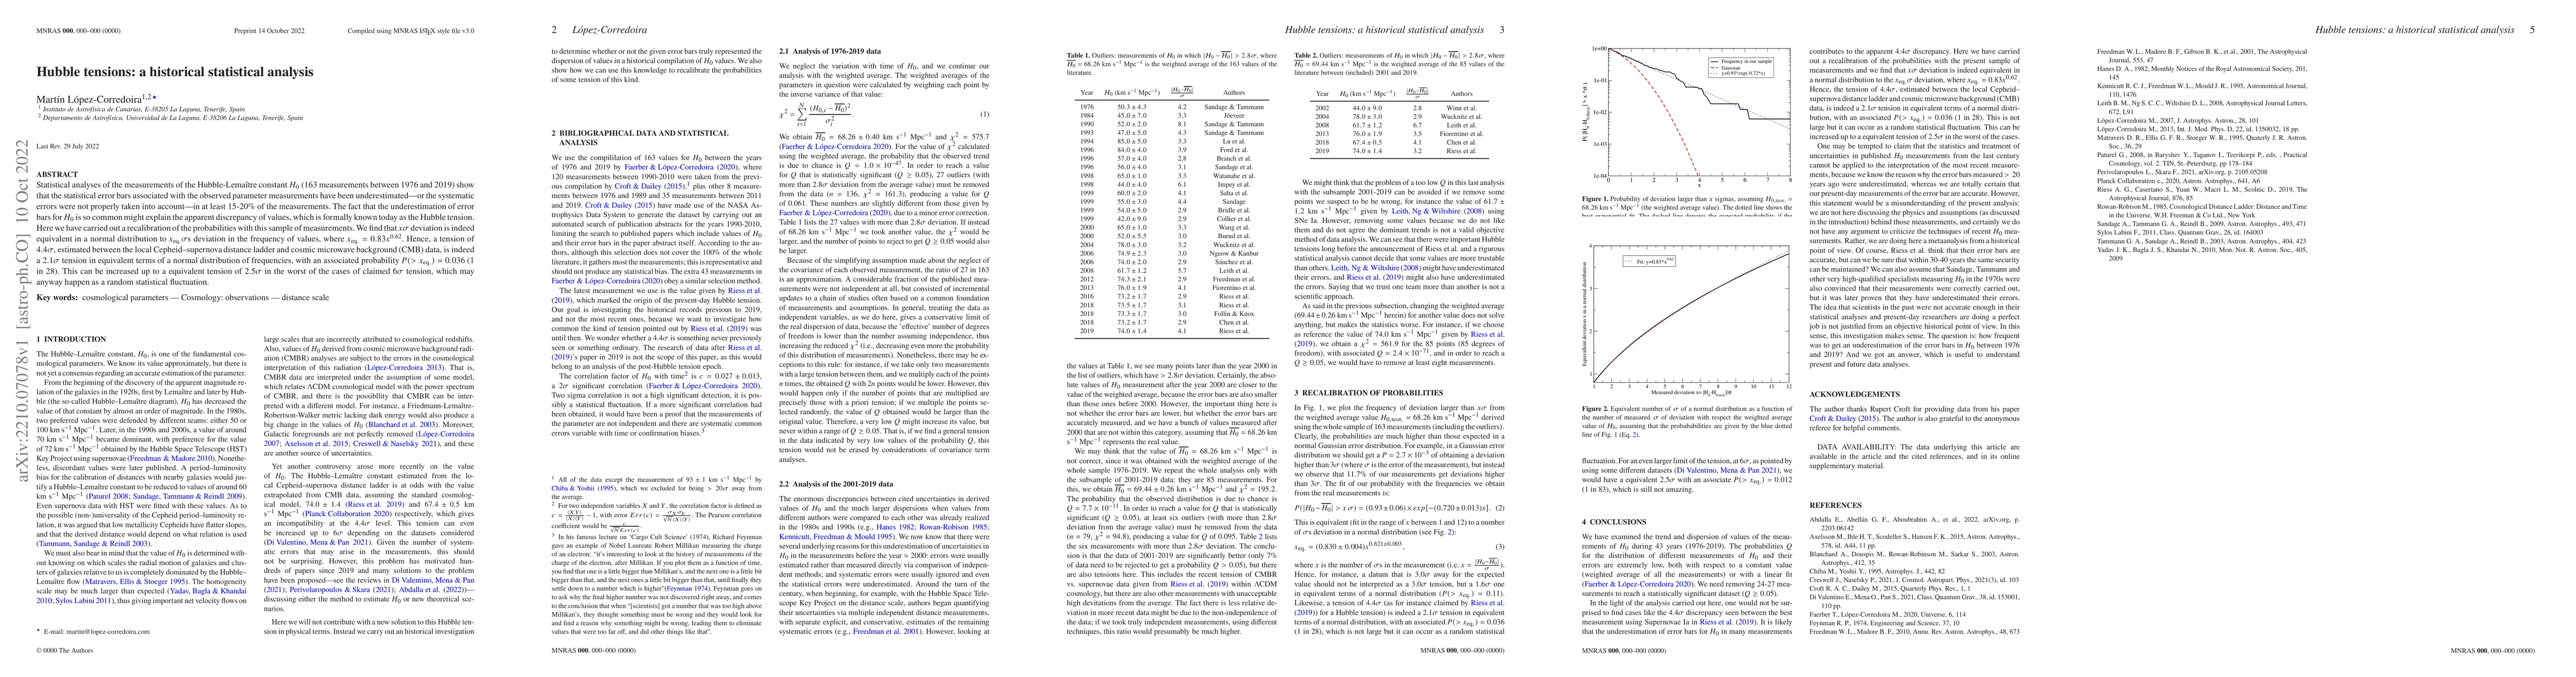
Statistical analyses of the measurements of the Hubble-Lema\^itre constant $H_0$ (163 measurements between 1976 and 2019) show that the statistical error bars associated with the observed parameter measurements have been underestimated -- or the systematic errors were not properly taken into account -- in at least 15-20\% of the measurements. The fact that the underestimation of error bars for $H_0$ is so common might explain the apparent discrepancy of values, which is formally known today as the Hubble tension. Here we have carried out a recalibration of the probabilities with this sample of measurements. We find that $x\sigma $ deviation is indeed equivalent in a normal distribution to $x_{\rm eq.}\sigma $s deviation in the frequency of values, where $x_{\rm eq.}=0.83x^{0.62}$. Hence, a tension of 4.4$\sigma $, estimated between the local Cepheid-supernova distance ladder and cosmic microwave background (CMB) data, is indeed a 2.1$\sigma $ tension in equivalent terms of a normal distribution of frequencies, with an associated probability $P(>x_{\rm eq.})=0.036$ (1 in 28). This can be increased up to a equivalent tension of 2.5$\sigma $ in the worst of the cases of claimed 6$\sigma $ tension, which may anyway happen as a random statistical fluctuation.
AI Key Findings
Get AI-generated insights about this paper's methodology, results, significance, and more — seven facets brought into focus.
Impact
Paper Details
Authors
PDF Preview
Key Terms
Citation Network
Current paper (gray), citations (green), references (blue)
Display is limited for performance on very large graphs.
Discussion 0