Hysteresis Behind A Freeway Bottleneck With Location-Dependent Capacity
Publication
Metrics
AI Quick Summary
This study investigates hysteresis in Macroscopic Fundamental Diagrams (MFDs) and Network Exit Functions (NEFs) during rush hour, identifying a figure-eight hysteresis pattern in a freeway bottleneck scenario. The research finds that demand asymmetries contribute to counter-clockwise loops in MFDs, with empirical data showing that continuous bottlenecks exhibit less hysteresis than discontinuous ones.
Paper Preview
Abstract
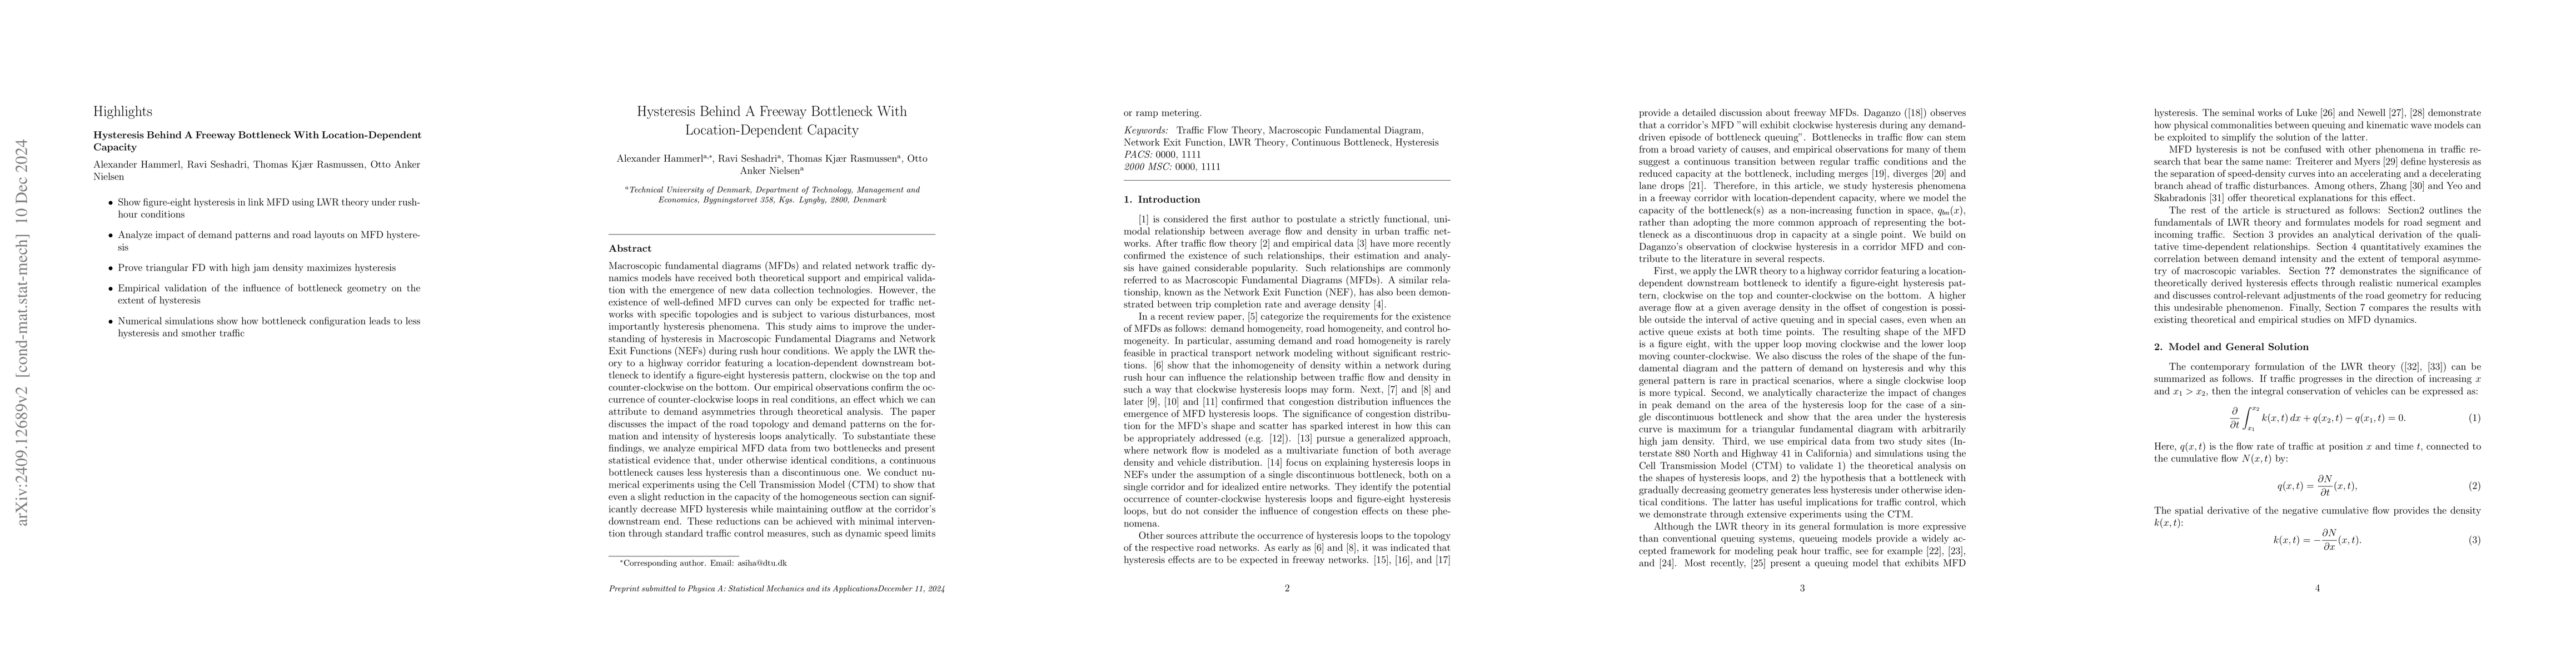
Macroscopic fundamental diagrams (MFDs) and related network traffic dynamics models have received both theoretical support and empirical validation with the emergence of new data collection technologies. However, the existence of well-defined MFD curves can only be expected for traffic networks with specific topologies and is subject to various disturbances, most importantly hysteresis phenomena. This study aims to improve the understanding of hysteresis in Macroscopic Fundamental Diagrams and Network Exit Functions (NEFs) during rush hour conditions. We apply the LWR theory to a highway corridor featuring a location-dependent downstream bottleneck to identify a figure-eight hysteresis pattern, clockwise on the top and counter-clockwise on the bottom. Our empirical observations confirm the occurrence of counter-clockwise loops in real conditions, an effect which we can attribute to demand asymmetries through theoretical analysis. The paper discusses the impact of the road topology and demand patterns on the formation and intensity of hysteresis loops analytically. To substantiate these findings, we analyze empirical MFD data from two bottlenecks and present statistical evidence that, under otherwise identical conditions, a continuous bottleneck causes less hysteresis than a discontinuous one. We conduct numerical experiments using the Cell Transmission Model (CTM) to show that even a slight reduction in the capacity of the homogeneous section can significantly decrease MFD hysteresis while maintaining outflow at the corridor's downstream end. These reductions can be achieved with minimal intervention through standard traffic control measures, such as dynamic speed limits or ramp metering.
AI Key Findings
Get AI-generated insights about this paper's methodology, results, significance, and more — seven facets brought into focus.
Authors
PDF Preview
Related Papers
No references found for this paper.
Discussion 0