Publication
Metrics
AI Quick Summary
This paper proposes a parametric method to identify precise time frames for significant changes in gene expression using a flexible two-step bootstrap approach to construct confidence bands for the first derivative of the time-response data, enhancing the accuracy over traditional multiple t-tests. The method is validated through simulations and applied to mouse gene expression data assessing the impact of a Western diet on non-alcoholic fatty liver disease.
Paper Preview
Abstract
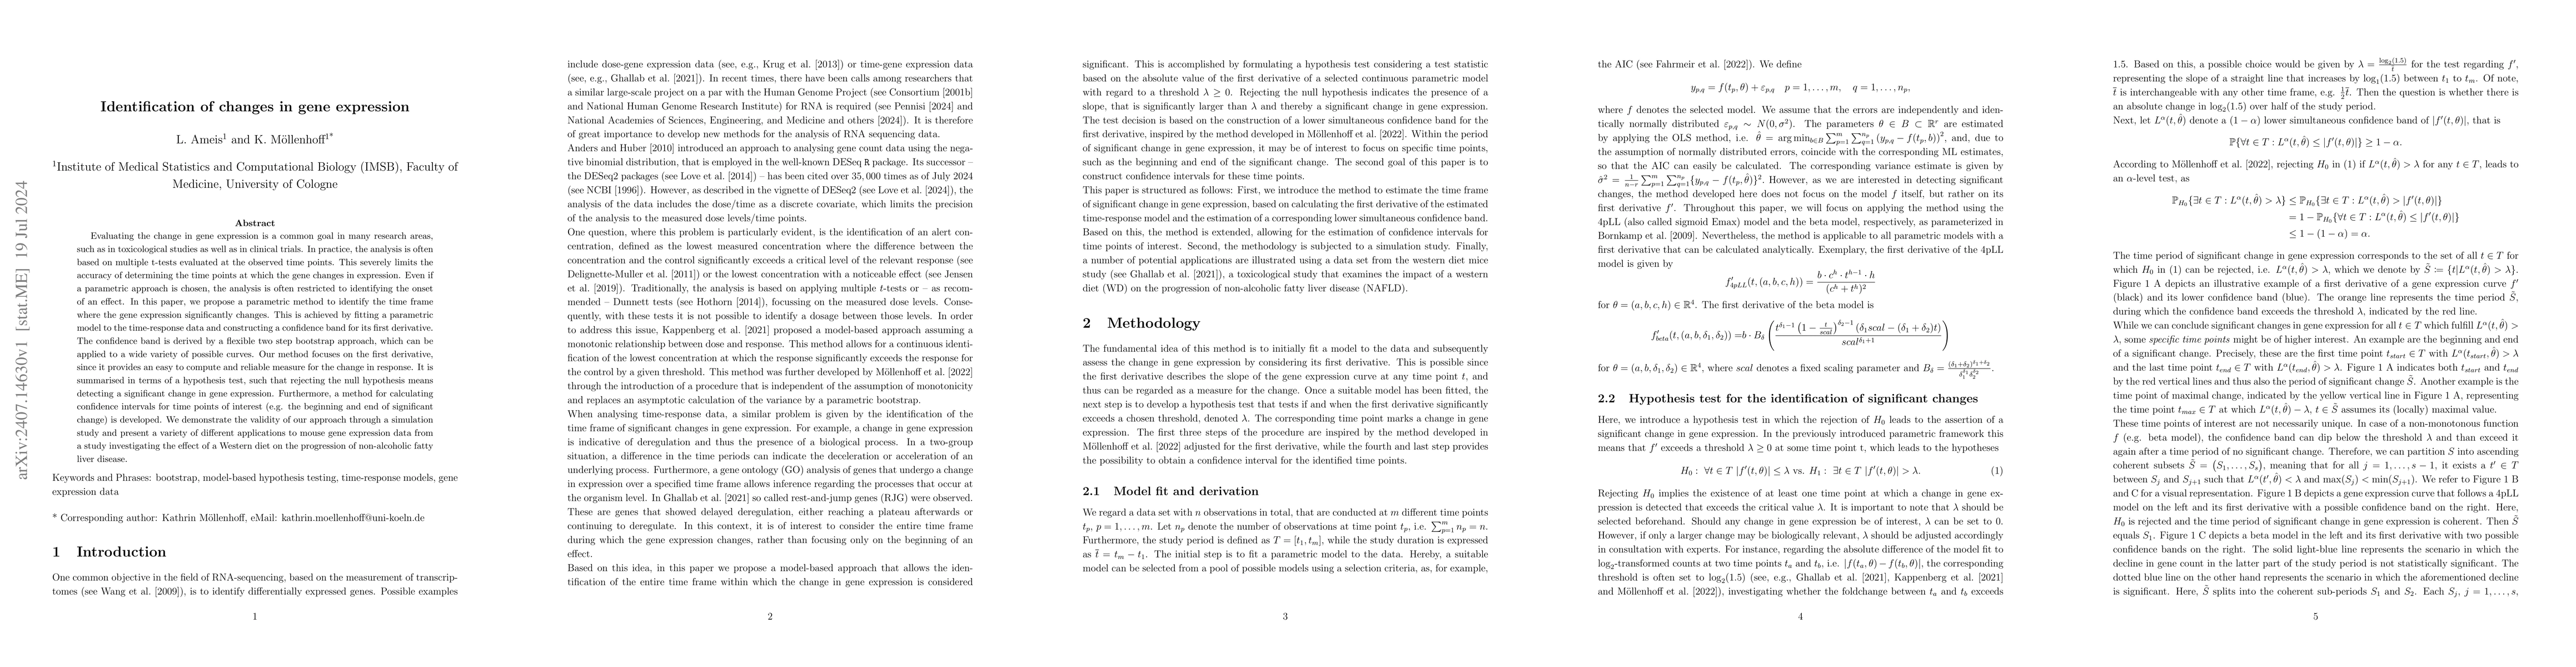
Evaluating the change in gene expression is a common goal in many research areas, such as in toxicological studies as well as in clinical trials. In practice, the analysis is often based on multiple t-tests evaluated at the observed time points. This severely limits the accuracy of determining the time points at which the gene changes in expression. Even if a parametric approach is chosen, the analysis is often restricted to identifying the onset of an effect. In this paper, we propose a parametric method to identify the time frame where the gene expression significantly changes. This is achieved by fitting a parametric model to the time-response data and constructing a confidence band for its first derivative. The confidence band is derived by a flexible two step bootstrap approach, which can be applied to a wide variety of possible curves. Our method focuses on the first derivative, since it provides an easy to compute and reliable measure for the change in response. It is summarised in terms of a hypothesis test, such that rejecting the null hypothesis means detecting a significant change in gene expression. Furthermore, a method for calculating confidence intervals for time points of interest (e.g. the beginning and end of significant change) is developed. We demonstrate the validity of our approach through a simulation study and present a variety of different applications to mouse gene expression data from a study investigating the effect of a Western diet on the progression of non-alcoholic fatty liver disease.
AI Key Findings
Get AI-generated insights about this paper's methodology, results, significance, and more — seven facets brought into focus.
Impact
Authors
PDF Preview
Citation Network
Current paper (gray), citations (green), references (blue)
Display is limited for performance on very large graphs.
Discussion 0