Summary
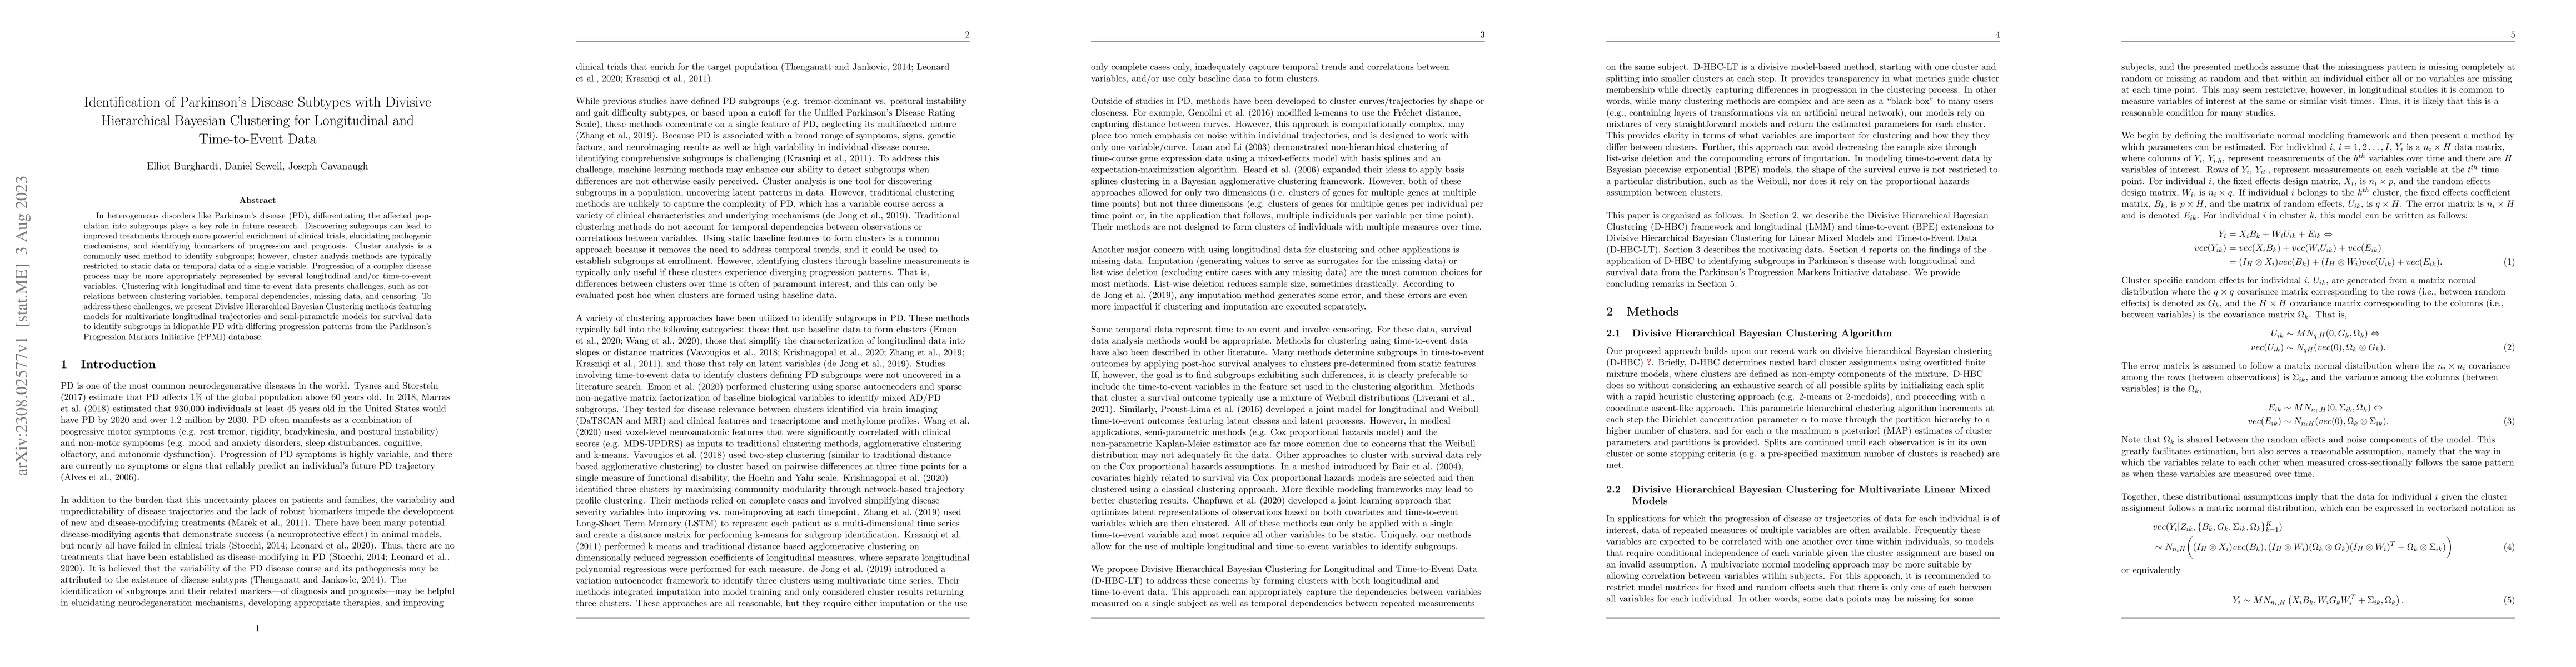
In heterogeneous disorders like Parkinson's disease (PD), differentiating the affected population into subgroups plays a key role in future research. Discovering subgroups can lead to improved treatments through more powerful enrichment of clinical trials, elucidating pathogenic mechanisms, and identifying biomarkers of progression and prognosis. Cluster analysis is a commonly used method to identify subgroups; however, cluster analysis methods are typically restricted to static data or temporal data of a single variable. Progression of a complex disease process may be more appropriately represented by several longitudinal and/or time-to-event variables. Clustering with longitudinal and time-to-event data presents challenges, such as correlations between clustering variables, temporal dependencies, missing data, and censoring. To address these challenges, we present Divisive Hierarchical Bayesian Clustering methods featuring models for multivariate longitudinal trajectories and semi-parametric models for survival data to identify subgroups in idiopathic PD with differing progression patterns from the Parkinson's Progression Markers Initiative (PPMI) database.
AI Key Findings
Get AI-generated insights about this paper's methodology, results, and significance.
Paper Details
PDF Preview
Key Terms
Citation Network
Current paper (gray), citations (green), references (blue)
Display is limited for performance on very large graphs.
Similar Papers
Found 4 papersHiPart: Hierarchical Divisive Clustering Toolbox
Panagiotis Anagnostou, Sotiris Tasoulis, Vassilis Plagianakos et al.
No citations found for this paper.
Comments (0)