Summary
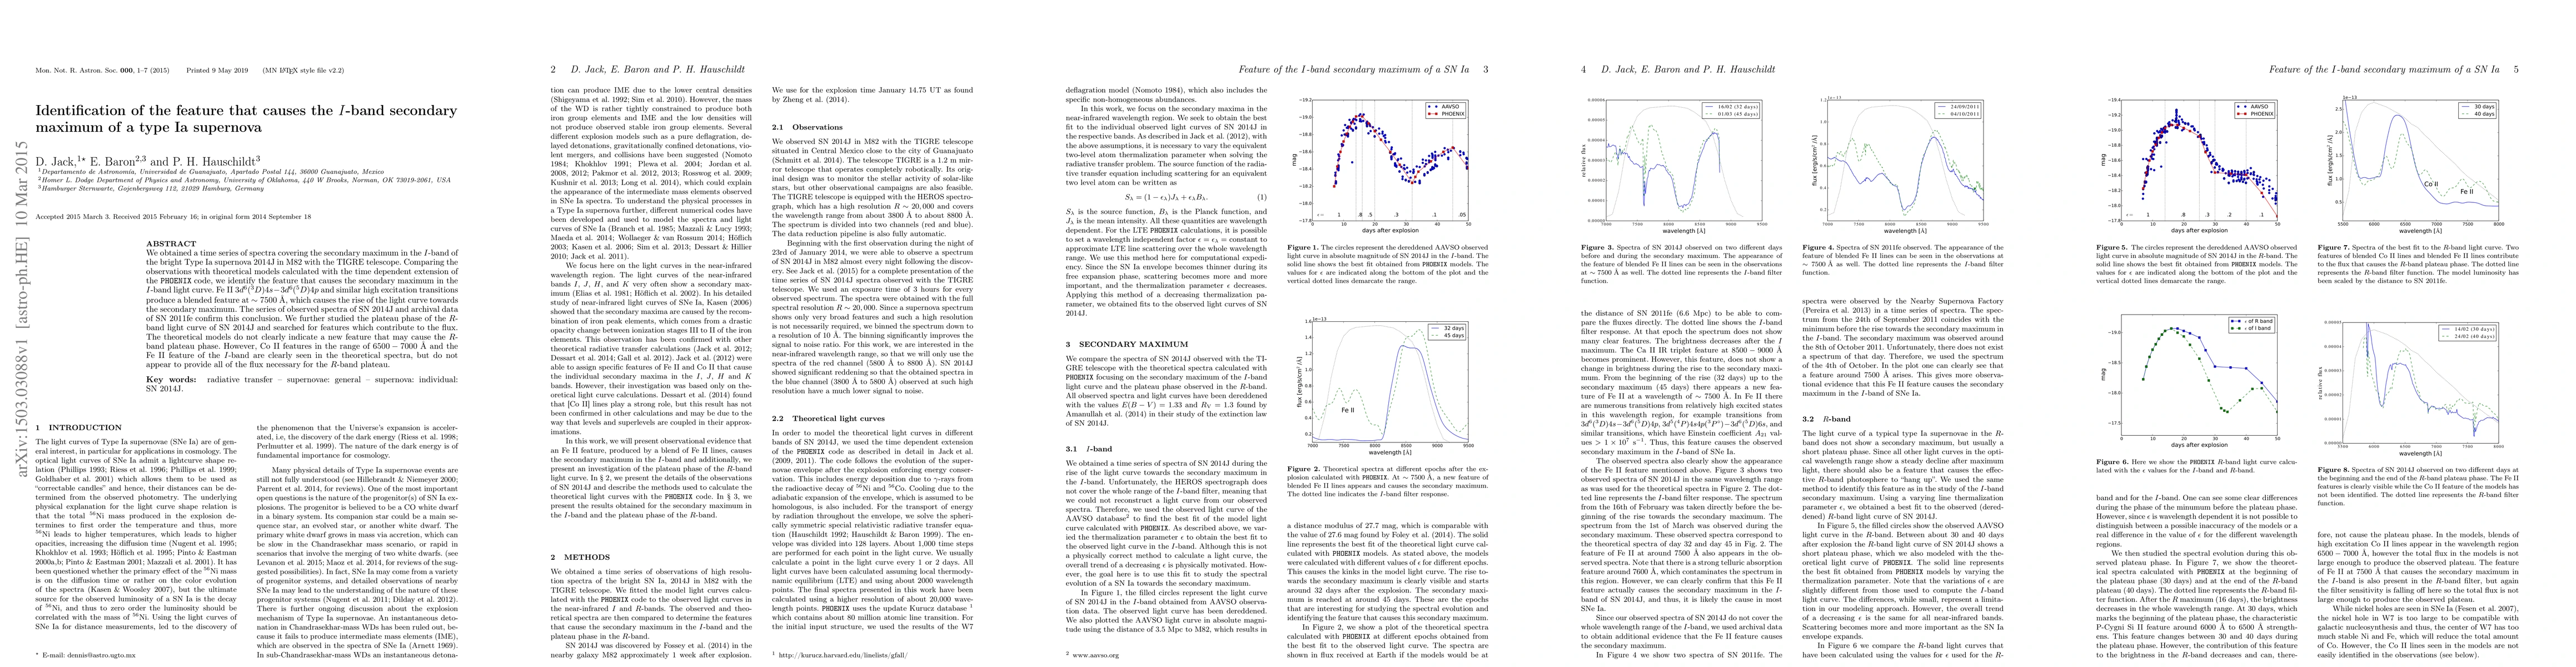
We obtained a time series of spectra covering the secondary maximum in the I-band of the bright Type Ia supernova 2014J in M82 with the TIGRE telescope. Comparing the observations with theoretical models calculated with the time dependent extension of the PHOENIX code, we identify the feature that causes the secondary maximum in the I-band light curve. Fe II 3d6(3D)4s-3d6(5D)4p and similar high excitation transitions produce a blended feature at 7500 {\AA}, which causes the rise of the light curve towards the secondary maximum. The series of observed spectra of SN 2014J and archival data of SN 2011fe confirm this conclusion. We further studied the plateau phase of the Rband light curve of SN 2014J and searched for features which contribute to the flux. The theoretical models do not clearly indicate a new feature that may cause the Rband plateau phase. However, Co II features in the range of 6500 - 7000 {\AA} and the Fe II feature of the I-band are clearly seen in the theoretical spectra, but do not appear to provide all of the flux necessary for the R-band plateau.
AI Key Findings
Get AI-generated insights about this paper's methodology, results, and significance.
Paper Details
PDF Preview
Key Terms
Citation Network
Current paper (gray), citations (green), references (blue)
Display is limited for performance on very large graphs.
Similar Papers
Found 4 papersZTF SN Ia DR2: The secondary maximum in Type Ia supernovae
M. Deckers, K. Maguire, L. Shingles et al.
Carnegie Supernova Project: kinky $i$-band light-curves of Type Ia supernovae
C. Ashall, P. Hoeflich, E. Baron et al.
| Title | Authors | Year | Actions |
|---|
Comments (0)