Identifying Challenges in Designing, Developing and Evaluating Data Visualizations for Large Displays
Publication
Metrics
AI Quick Summary
This study investigates the challenges faced by designers and developers when creating data visualizations for large displays through interviews with experts, identifying key issues via affinity diagramming to guide future research and development in this field.
Paper Preview
Abstract
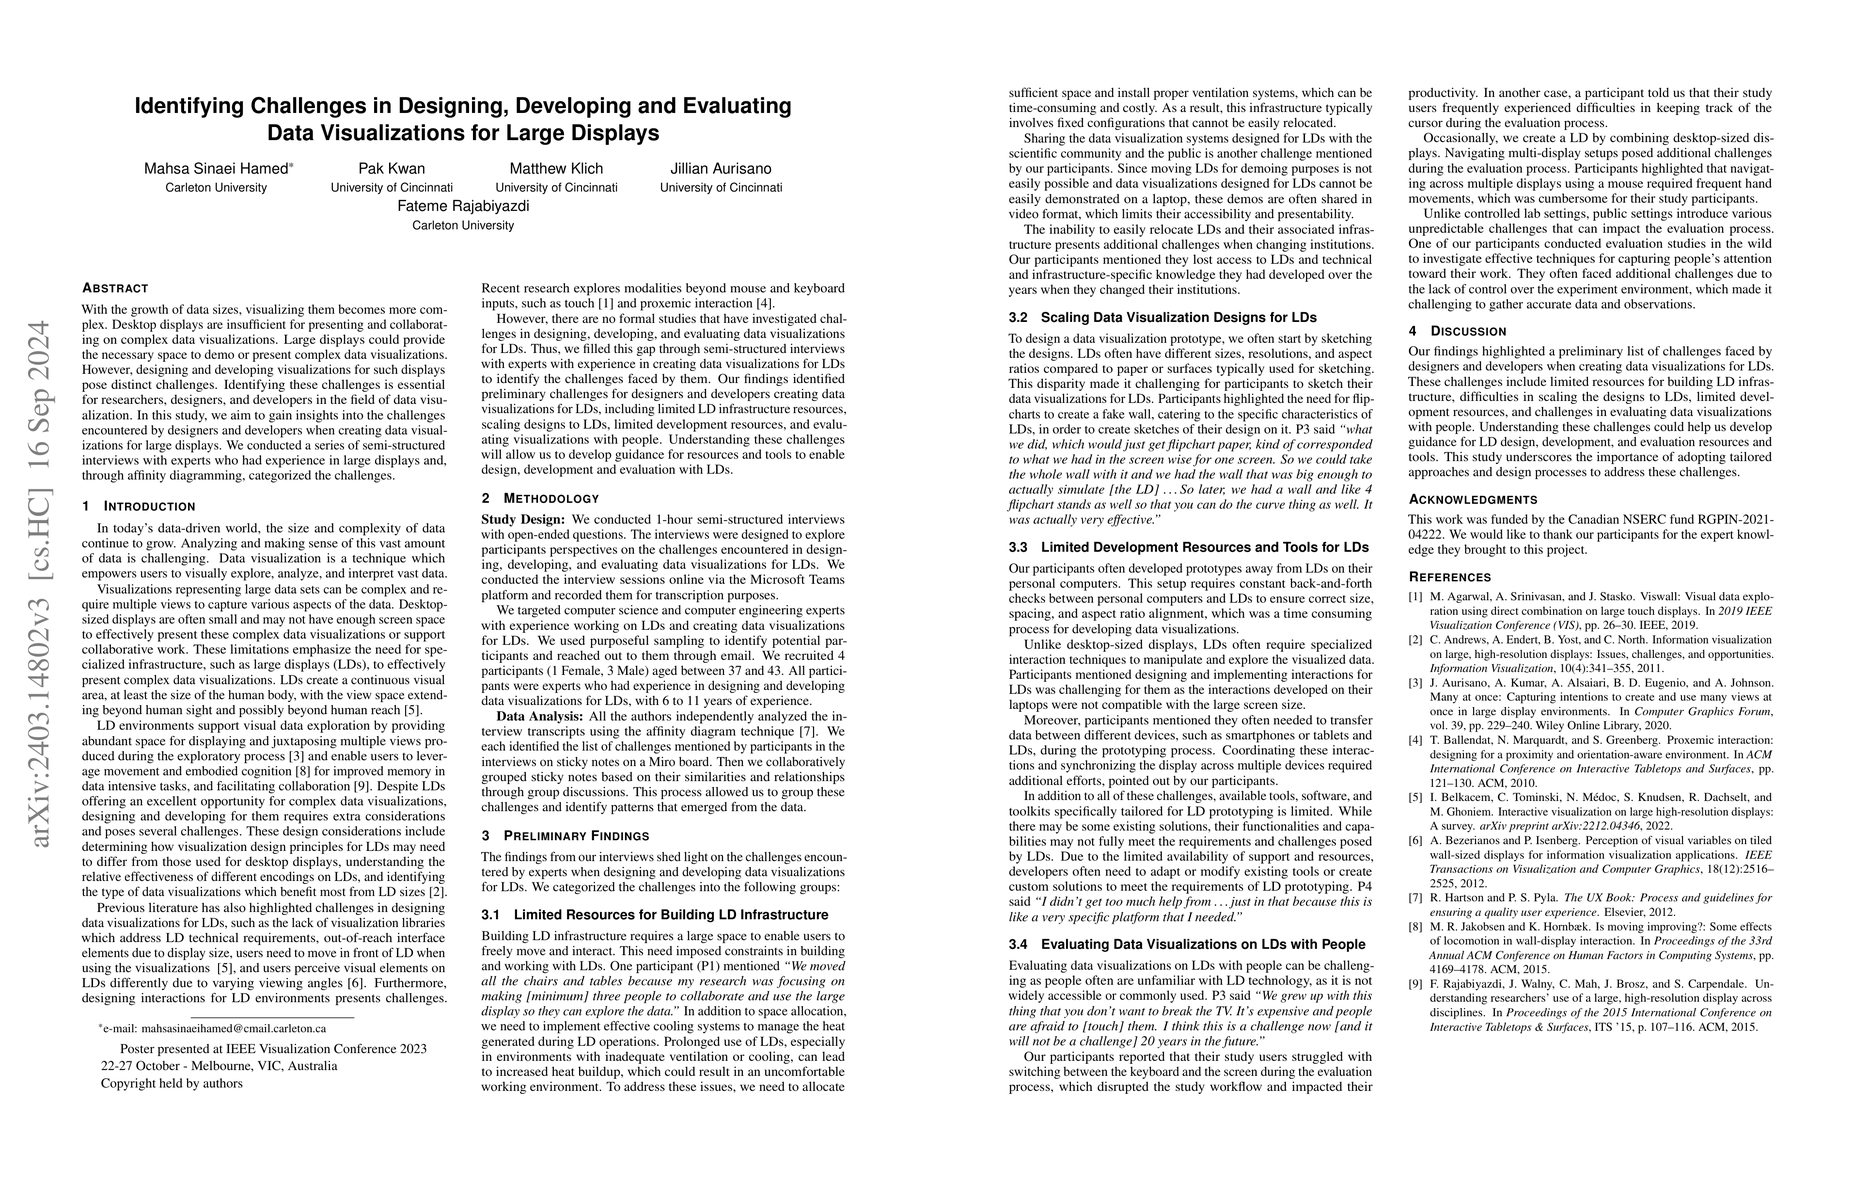
With the growth of data sizes, visualizing them becomes more complex. Desktop displays are insufficient for presenting and collaborating on complex data visualizations. Large displays could provide the necessary space to demo or present complex data visualizations. However, designing and developing visualizations for such displays pose distinct challenges. Identifying these challenges is essential for researchers, designers, and developers in the field of data visualization. In this study, we aim to gain insights into the challenges encountered by designers and developers when creating data visualizations for large displays. We conducted a series of semi-structured interviews with experts who had experience in large displays and, through affinity diagramming, categorized the challenges.
AI Key Findings
Get AI-generated insights about this paper's methodology, results, significance, and more — seven facets brought into focus.
Impact
Paper Details
Authors
PDF Preview
Key Terms
Citation Network
Current paper (gray), citations (green), references (blue)
Display is limited for performance on very large graphs.
Discussion 0